Live results
Updated: Nov. 5, 3:08 PM ET











Texas Election Results: District
House Results
Vote data from the AP
Texas District 1
Bowie County
Live results
Updated: Nov. 5, 10:35 AM ET
| Candidate | Party | % | Total Votes | |
|---|---|---|---|---|
 | Nathaniel Moran* | Republican party | 66% | 13,603 |
 | Yolanda Prince | Democrat party | 34% | 7,046 |
Cass County
Live results
Updated: Nov. 5, 10:35 AM ET
| Candidate | Party | % | Total Votes | |
|---|---|---|---|---|
| Nathaniel Moran* | Republican party | 80% | 8,681 |
| Yolanda Prince | Democrat party | 20% | 2,155 |
Cherokee County
Live results
Updated: Nov. 5, 10:35 AM ET
| Candidate | Party | % | Total Votes | |
|---|---|---|---|---|
| Nathaniel Moran* | Republican party | 75% | 12,451 |
| Yolanda Prince | Democrat party | 25% | 4,104 |
Gregg County
Live results
Updated: Nov. 5, 10:35 AM ET
| Candidate | Party | % | Total Votes | |
|---|---|---|---|---|
| Nathaniel Moran* | Republican party | 64% | 24,254 |
| Yolanda Prince | Democrat party | 36% | 13,618 |
Harrison County
Live results
Updated: Nov. 5, 10:35 AM ET
| Candidate | Party | % | Total Votes | |
|---|---|---|---|---|
| Nathaniel Moran* | Republican party | 70% | 16,903 |
| Yolanda Prince | Democrat party | 30% | 7,100 |
Marion County
Live results
Updated: Nov. 5, 10:35 AM ET
| Candidate | Party | % | Total Votes | |
|---|---|---|---|---|
| Nathaniel Moran* | Republican party | 74% | 2,805 |
| Yolanda Prince | Democrat party | 26% | 1,005 |
Nacogdoches County
Live results
Updated: Nov. 5, 10:35 AM ET
| Candidate | Party | % | Total Votes | |
|---|---|---|---|---|
| Nathaniel Moran* | Republican party | 61% | 12,832 |
| Yolanda Prince | Democrat party | 39% | 8,269 |
Panola County
Live results
Updated: Nov. 5, 10:35 AM ET
| Candidate | Party | % | Total Votes | |
|---|---|---|---|---|
| Nathaniel Moran* | Republican party | 79% | 6,744 |
| Yolanda Prince | Democrat party | 21% | 1,786 |
Rusk County
Live results
Updated: Nov. 5, 10:35 AM ET
| Candidate | Party | % | Total Votes | |
|---|---|---|---|---|
| Nathaniel Moran* | Republican party | 74% | 12,762 |
| Yolanda Prince | Democrat party | 26% | 4,445 |
Sabine County
Live results
Updated: Nov. 5, 10:35 AM ET
| Candidate | Party | % | Total Votes | |
|---|---|---|---|---|
| Nathaniel Moran* | Republican party | 88% | 3,726 |
| Yolanda Prince | Democrat party | 12% | 528 |
San Augustine County
Live results
Updated: Nov. 5, 10:35 AM ET
| Candidate | Party | % | Total Votes | |
|---|---|---|---|---|
| Nathaniel Moran* | Republican party | 73% | 2,231 |
| Yolanda Prince | Democrat party | 27% | 831 |
Shelby County
Live results
Updated: Nov. 5, 10:35 AM ET
| Candidate | Party | % | Total Votes | |
|---|---|---|---|---|
| Nathaniel Moran* | Republican party | 76% | 5,663 |
| Yolanda Prince | Democrat party | 24% | 1,776 |
Smith County
Live results
Updated: Nov. 5, 10:35 AM ET
| Candidate | Party | % | Total Votes | |
|---|---|---|---|---|
| Nathaniel Moran* | Republican party | 67% | 59,332 |
| Yolanda Prince | Democrat party | 33% | 28,935 |
Texas District 2
Harris County
Live results
Updated: Nov. 5, 10:35 AM ET
| Candidate | Party | % | Total Votes | |
|---|---|---|---|---|
 | Shaun Finnie | Democrat party | 54% | 82,145 |
 | Steve Toth | Republican party | 46% | 70,563 |
Montgomery County
Live results
Updated: Nov. 5, 3:06 PM ET
| Candidate | Party | % | Total Votes | |
|---|---|---|---|---|
| Steve Toth | Republican party | 57% | 74,185 |
| Shaun Finnie | Democrat party | 43% | 57,022 |
Texas District 3
Collin County
Live results
Updated: Nov. 5, 3:05 PM ET
| Candidate | Party | % | Total Votes | |
|---|---|---|---|---|
 | Evan Hunt | Democrat party | 51% | 134,580 |
 | Keith Self* | Republican party | 49% | 128,340 |
Delta County
Live results
Updated: Nov. 5, 10:35 AM ET
| Candidate | Party | % | Total Votes | |
|---|---|---|---|---|
| Keith Self* | Republican party | 81% | 1,628 |
| Evan Hunt | Democrat party | 19% | 371 |
Franklin County
Live results
Updated: Nov. 5, 11:06 AM ET
| Candidate | Party | % | Total Votes | |
|---|---|---|---|---|
| Keith Self* | Republican party | 81% | 3,414 |
| Evan Hunt | Democrat party | 19% | 795 |
Hopkins County
Live results
Updated: Nov. 5, 10:35 AM ET
| Candidate | Party | % | Total Votes | |
|---|---|---|---|---|
| Keith Self* | Republican party | 76% | 10,062 |
| Evan Hunt | Democrat party | 24% | 3,216 |
Hunt County
Live results
Updated: Nov. 5, 10:35 AM ET
| Candidate | Party | % | Total Votes | |
|---|---|---|---|---|
| Keith Self* | Republican party | 67% | 17,223 |
| Evan Hunt | Democrat party | 33% | 8,508 |
Morris County
Live results
Updated: Nov. 5, 10:35 AM ET
| Candidate | Party | % | Total Votes | |
|---|---|---|---|---|
| Keith Self* | Republican party | 71% | 2,940 |
| Evan Hunt | Democrat party | 29% | 1,228 |
Titus County
Live results
Updated: Nov. 5, 10:35 AM ET
| Candidate | Party | % | Total Votes | |
|---|---|---|---|---|
| Keith Self* | Republican party | 65% | 5,636 |
| Evan Hunt | Democrat party | 35% | 2,969 |
Texas District 4
Bowie County
Live results
Updated: Nov. 5, 10:35 AM ET
| Candidate | Party | % | Total Votes | |
|---|---|---|---|---|
 | Pat Fallon* | Republican party | 79% | 5,344 |
 | Jason Pearce | Democrat party | 21% | 1,395 |
Collin County
Live results
Updated: Nov. 5, 3:05 PM ET
| Candidate | Party | % | Total Votes | |
|---|---|---|---|---|
| Jason Pearce | Democrat party | 53% | 91,314 |
| Pat Fallon* | Republican party | 47% | 81,475 |
Denton County
Live results
Updated: Nov. 5, 10:35 AM ET
| Candidate | Party | % | Total Votes | |
|---|---|---|---|---|
| Pat Fallon* | Republican party | 51% | 20,437 |
| Jason Pearce | Democrat party | 49% | 19,409 |
Fannin County
Live results
Updated: Nov. 5, 10:35 AM ET
| Candidate | Party | % | Total Votes | |
|---|---|---|---|---|
| Pat Fallon* | Republican party | 79% | 10,238 |
| Jason Pearce | Democrat party | 21% | 2,718 |
Grayson County
Live results
Updated: Nov. 5, 10:35 AM ET
| Candidate | Party | % | Total Votes | |
|---|---|---|---|---|
| Pat Fallon* | Republican party | 72% | 38,617 |
| Jason Pearce | Democrat party | 28% | 14,767 |
Lamar County
Live results
Updated: Nov. 5, 10:35 AM ET
| Candidate | Party | % | Total Votes | |
|---|---|---|---|---|
| Pat Fallon* | Republican party | 76% | 12,331 |
| Jason Pearce | Democrat party | 24% | 3,950 |
Red River County
Live results
Updated: Nov. 5, 10:35 AM ET
| Candidate | Party | % | Total Votes | |
|---|---|---|---|---|
| Pat Fallon* | Republican party | 76% | 3,210 |
| Jason Pearce | Democrat party | 24% | 1,010 |
Texas District 5
Anderson County
Live results
Updated: Nov. 5, 10:35 AM ET
| Candidate | Party | % | Total Votes | |
|---|---|---|---|---|
 | Lance Gooden* | Republican party | 76% | 11,460 |
 | Chelsey Hockett | Democrat party | 24% | 3,681 |
Dallas County
Live results
Updated: Nov. 5, 10:35 AM ET
| Candidate | Party | % | Total Votes | |
|---|---|---|---|---|
| Chelsey Hockett | Democrat party | 64% | 79,507 |
| Lance Gooden* | Republican party | 36% | 44,606 |
Henderson County
Live results
Updated: Nov. 5, 10:35 AM ET
| Candidate | Party | % | Total Votes | |
|---|---|---|---|---|
| Lance Gooden* | Republican party | 77% | 23,751 |
| Chelsey Hockett | Democrat party | 23% | 7,126 |
Kaufman County
Live results
Updated: Nov. 5, 10:35 AM ET
| Candidate | Party | % | Total Votes | |
|---|---|---|---|---|
| Lance Gooden* | Republican party | 52% | 31,945 |
| Chelsey Hockett | Democrat party | 48% | 28,921 |
Van Zandt County
Live results
Updated: Nov. 5, 10:35 AM ET
| Candidate | Party | % | Total Votes | |
|---|---|---|---|---|
| Lance Gooden* | Republican party | 84% | 18,516 |
| Chelsey Hockett | Democrat party | 16% | 3,620 |
Texas District 6
Dallas County
Live results
Updated: Nov. 5, 10:35 AM ET
| Candidate | Party | % | Total Votes | |
|---|---|---|---|---|
 | Danny Minton | Democrat party | 67% | 28,759 |
 | Jake Ellzey* | Republican party | 33% | 14,390 |
Ellis County
Live results
Updated: Nov. 5, 10:35 AM ET
| Candidate | Party | % | Total Votes | |
|---|---|---|---|---|
| Jake Ellzey* | Republican party | 57% | 49,320 |
| Danny Minton | Democrat party | 43% | 37,691 |
Johnson County
Live results
Updated: Nov. 5, 10:35 AM ET
| Candidate | Party | % | Total Votes | |
|---|---|---|---|---|
| Jake Ellzey* | Republican party | 64% | 23,633 |
| Danny Minton | Democrat party | 36% | 13,152 |
Navarro County
Live results
Updated: Nov. 5, 10:35 AM ET
| Candidate | Party | % | Total Votes | |
|---|---|---|---|---|
| Jake Ellzey* | Republican party | 69% | 11,072 |
| Danny Minton | Democrat party | 31% | 5,059 |
Tarrant County
Live results
Updated: Nov. 5, 10:35 AM ET
| Candidate | Party | % | Total Votes | |
|---|---|---|---|---|
| Danny Minton | Democrat party | 51% | 43,733 |
| Jake Ellzey* | Republican party | 49% | 41,599 |
Texas District 7
Fort Bend County
Live results
Updated: Nov. 5, 11:01 AM ET
| Candidate | Party | % | Total Votes | |
|---|---|---|---|---|
 | Lizzie Pannill Fletcher* | Democrat party | 71% | 40,231 |
 | Alexander Hale | Republican party | 27% | 15,188 |
Show More
Harris County
Live results
Updated: Nov. 5, 10:35 AM ET
| Candidate | Party | % | Total Votes | |
|---|---|---|---|---|
| Lizzie Pannill Fletcher* | Democrat party | 71% | 120,223 |
| Alexander Hale | Republican party | 28% | 47,199 |
Show More
Texas District 8
Harris County
Live results
Updated: Nov. 5, 10:35 AM ET
| Candidate | Party | % | Total Votes | |
|---|---|---|---|---|
 | Laura Jones | Democrat party | 68% | 75,237 |
 | Jessica Hart Steinmann | Republican party | 32% | 35,481 |
Montgomery County
Live results
Updated: Nov. 5, 3:06 PM ET
| Candidate | Party | % | Total Votes | |
|---|---|---|---|---|
| Jessica Hart Steinmann | Republican party | 72% | 89,849 |
| Laura Jones | Democrat party | 28% | 35,369 |
Walker County
Live results
Updated: Nov. 5, 10:35 AM ET
| Candidate | Party | % | Total Votes | |
|---|---|---|---|---|
| Jessica Hart Steinmann | Republican party | 55% | 3,839 |
| Laura Jones | Democrat party | 45% | 3,141 |
Waller County
Live results
Updated: Nov. 5, 10:35 AM ET
| Candidate | Party | % | Total Votes | |
|---|---|---|---|---|
| Jessica Hart Steinmann | Republican party | 54% | 12,617 |
| Laura Jones | Democrat party | 46% | 10,933 |
Texas District 9
Harris County
Live results
Updated: Nov. 5, 10:35 AM ET
| Candidate | Party | % | Total Votes | |
|---|---|---|---|---|
 | Leticia Gutierrez | Democrat party | 62% | 89,752 |
 | Alex Mealer | Republican party | 38% | 55,354 |
Liberty County
Live results
Updated: Nov. 5, 10:35 AM ET
| Candidate | Party | % | Total Votes | |
|---|---|---|---|---|
| Alex Mealer | Republican party | 67% | 16,986 |
| Leticia Gutierrez | Democrat party | 33% | 8,327 |
Texas District 10
Bastrop County
Live results
Updated: Nov. 5, 10:35 AM ET
| Candidate | Party | % | Total Votes | |
|---|---|---|---|---|
 | Caitlin Rourk | Democrat party | 54% | 357 |
 | Chris Gober | Republican party | 46% | 303 |
Brazos County
Live results
Updated: Nov. 5, 10:35 AM ET
| Candidate | Party | % | Total Votes | |
|---|---|---|---|---|
| Chris Gober | Republican party | 51% | 40,105 |
| Caitlin Rourk | Democrat party | 49% | 39,218 |
Burleson County
Live results
Updated: Nov. 5, 10:35 AM ET
| Candidate | Party | % | Total Votes | |
|---|---|---|---|---|
| Chris Gober | Republican party | 77% | 5,961 |
| Caitlin Rourk | Democrat party | 23% | 1,827 |
Grimes County
Live results
Updated: Nov. 5, 10:35 AM ET
| Candidate | Party | % | Total Votes | |
|---|---|---|---|---|
| Chris Gober | Republican party | 74% | 8,645 |
| Caitlin Rourk | Democrat party | 26% | 2,976 |
Houston County
Live results
Updated: Nov. 5, 10:35 AM ET
| Candidate | Party | % | Total Votes | |
|---|---|---|---|---|
| Chris Gober | Republican party | 75% | 5,546 |
| Caitlin Rourk | Democrat party | 25% | 1,833 |
Lee County
Live results
Updated: Nov. 5, 10:35 AM ET
| Candidate | Party | % | Total Votes | |
|---|---|---|---|---|
| Chris Gober | Republican party | 74% | 5,076 |
| Caitlin Rourk | Democrat party | 26% | 1,768 |
Leon County
Live results
Updated: Nov. 5, 10:35 AM ET
| Candidate | Party | % | Total Votes | |
|---|---|---|---|---|
| Chris Gober | Republican party | 85% | 5,979 |
| Caitlin Rourk | Democrat party | 15% | 1,032 |
Madison County
Live results
Updated: Nov. 5, 10:35 AM ET
| Candidate | Party | % | Total Votes | |
|---|---|---|---|---|
| Chris Gober | Republican party | 76% | 3,267 |
| Caitlin Rourk | Democrat party | 24% | 1,015 |
Polk County
Live results
Updated: Nov. 5, 10:35 AM ET
| Candidate | Party | % | Total Votes | |
|---|---|---|---|---|
| Chris Gober | Republican party | 75% | 13,088 |
| Caitlin Rourk | Democrat party | 25% | 4,348 |
San Jacinto County
Live results
Updated: Nov. 5, 10:35 AM ET
| Candidate | Party | % | Total Votes | |
|---|---|---|---|---|
| Chris Gober | Republican party | 78% | 8,031 |
| Caitlin Rourk | Democrat party | 22% | 2,331 |
Travis County
Live results
Updated: Nov. 5, 10:43 AM ET
| Candidate | Party | % | Total Votes | |
|---|---|---|---|---|
| Caitlin Rourk | Democrat party | 60% | 76,151 |
| Chris Gober | Republican party | 40% | 51,508 |
Trinity County
Live results
Updated: Nov. 5, 10:35 AM ET
| Candidate | Party | % | Total Votes | |
|---|---|---|---|---|
| Chris Gober | Republican party | 80% | 4,507 |
| Caitlin Rourk | Democrat party | 20% | 1,148 |
Walker County
Live results
Updated: Nov. 5, 10:35 AM ET
| Candidate | Party | % | Total Votes | |
|---|---|---|---|---|
| Chris Gober | Republican party | 66% | 9,409 |
| Caitlin Rourk | Democrat party | 34% | 4,828 |
Texas District 11
Brown County
Live results
Updated: Nov. 5, 10:35 AM ET
| Candidate | Party | % | Total Votes | |
|---|---|---|---|---|
 | August Pfluger* | Republican party | 84% | 10,901 |
 | Claire Reynolds | Democrat party | 16% | 2,060 |
Burnet County
Live results
Updated: Nov. 5, 3:04 PM ET
| Candidate | Party | % | Total Votes | |
|---|---|---|---|---|
| August Pfluger* | Republican party | 70% | 3,187 |
| Claire Reynolds | Democrat party | 30% | 1,345 |
Coke County
Live results
Updated: Nov. 5, 10:35 AM ET
| Candidate | Party | % | Total Votes | |
|---|---|---|---|---|
| August Pfluger* | Republican party | 88% | 1,202 |
| Claire Reynolds | Democrat party | 12% | 158 |
Coleman County
Live results
Updated: Nov. 5, 10:35 AM ET
| Candidate | Party | % | Total Votes | |
|---|---|---|---|---|
| August Pfluger* | Republican party | 90% | 2,858 |
| Claire Reynolds | Democrat party | 10% | 325 |
Concho County
Live results
Updated: Nov. 5, 10:35 AM ET
| Candidate | Party | % | Total Votes | |
|---|---|---|---|---|
| August Pfluger* | Republican party | 86% | 858 |
| Claire Reynolds | Democrat party | 14% | 142 |
Ector County
Live results
Updated: Nov. 5, 10:35 AM ET
| Candidate | Party | % | Total Votes | |
|---|---|---|---|---|
| August Pfluger* | Republican party | 64% | 18,657 |
| Claire Reynolds | Democrat party | 36% | 10,662 |
Glasscock County
Live results
Updated: Nov. 5, 10:35 AM ET
| Candidate | Party | % | Total Votes | |
|---|---|---|---|---|
| August Pfluger* | Republican party | 93% | 526 |
| Claire Reynolds | Democrat party | 7% | 37 |
Irion County
Live results
Updated: Nov. 5, 10:35 AM ET
| Candidate | Party | % | Total Votes | |
|---|---|---|---|---|
| August Pfluger* | Republican party | 88% | 572 |
| Claire Reynolds | Democrat party | 12% | 77 |
Kimble County
Live results
Updated: Nov. 5, 10:35 AM ET
| Candidate | Party | % | Total Votes | |
|---|---|---|---|---|
| August Pfluger* | Republican party | 87% | 1,716 |
| Claire Reynolds | Democrat party | 13% | 248 |
Llano County
Live results
Updated: Nov. 5, 10:35 AM ET
| Candidate | Party | % | Total Votes | |
|---|---|---|---|---|
| August Pfluger* | Republican party | 79% | 9,203 |
| Claire Reynolds | Democrat party | 21% | 2,431 |
McCulloch County
Live results
Updated: Nov. 5, 10:35 AM ET
| Candidate | Party | % | Total Votes | |
|---|---|---|---|---|
| August Pfluger* | Republican party | 84% | 2,239 |
| Claire Reynolds | Democrat party | 16% | 423 |
Mason County
Live results
Updated: Nov. 5, 10:35 AM ET
| Candidate | Party | % | Total Votes | |
|---|---|---|---|---|
| August Pfluger* | Republican party | 82% | 1,756 |
| Claire Reynolds | Democrat party | 18% | 394 |
Menard County
Live results
Updated: Nov. 5, 10:35 AM ET
| Candidate | Party | % | Total Votes | |
|---|---|---|---|---|
| August Pfluger* | Republican party | 81% | 642 |
| Claire Reynolds | Democrat party | 19% | 147 |
Midland County
Live results
Updated: Nov. 5, 10:35 AM ET
| Candidate | Party | % | Total Votes | |
|---|---|---|---|---|
| August Pfluger* | Republican party | 74% | 32,072 |
| Claire Reynolds | Democrat party | 26% | 11,356 |
Runnels County
Live results
Updated: Nov. 5, 10:35 AM ET
| Candidate | Party | % | Total Votes | |
|---|---|---|---|---|
| August Pfluger* | Republican party | 87% | 2,751 |
| Claire Reynolds | Democrat party | 13% | 425 |
San Saba County
Live results
Updated: Nov. 5, 10:35 AM ET
| Candidate | Party | % | Total Votes | |
|---|---|---|---|---|
| August Pfluger* | Republican party | 87% | 1,873 |
| Claire Reynolds | Democrat party | 13% | 287 |
Sterling County
Live results
Updated: Nov. 5, 10:35 AM ET
| Candidate | Party | % | Total Votes | |
|---|---|---|---|---|
| August Pfluger* | Republican party | 90% | 402 |
| Claire Reynolds | Democrat party | 10% | 47 |
Tom Green County
Live results
Updated: Nov. 5, 10:35 AM ET
| Candidate | Party | % | Total Votes | |
|---|---|---|---|---|
| August Pfluger* | Republican party | 69% | 24,874 |
| Claire Reynolds | Democrat party | 31% | 11,160 |
Travis County
Live results
Updated: Nov. 5, 10:43 AM ET
| Candidate | Party | % | Total Votes | |
|---|---|---|---|---|
| Claire Reynolds | Democrat party | 69% | 44,570 |
| August Pfluger* | Republican party | 31% | 19,731 |
Williamson County
Live results
Updated: Nov. 5, 2:40 PM ET
| Candidate | Party | % | Total Votes | |
|---|---|---|---|---|
| Claire Reynolds | Democrat party | 76% | 8,059 |
| August Pfluger* | Republican party | 24% | 2,607 |
Texas District 12
Parker County
Live results
Updated: Nov. 5, 10:59 AM ET
| Candidate | Party | % | Total Votes | |
|---|---|---|---|---|
 | Craig Goldman* | Republican party | 79% | 44,388 |
 | Angela Rodriguez Prilliman | Democrat party | 21% | 11,576 |
Tarrant County
Live results
Updated: Nov. 5, 10:35 AM ET
| Candidate | Party | % | Total Votes | |
|---|---|---|---|---|
| Angela Rodriguez Prilliman | Democrat party | 54% | 115,880 |
| Craig Goldman* | Republican party | 46% | 100,050 |
Texas District 13
Archer County
Live results
Updated: Nov. 5, 10:35 AM ET
| Candidate | Party | % | Total Votes | |
|---|---|---|---|---|
 | Ronny Jackson* | Republican party | 88% | 3,517 |
 | Mark Nair | Democrat party | 12% | 487 |
Armstrong County
Live results
Updated: Nov. 5, 10:35 AM ET
| Candidate | Party | % | Total Votes | |
|---|---|---|---|---|
| Ronny Jackson* | Republican party | 91% | 794 |
| Mark Nair | Democrat party | 9% | 77 |
Baylor County
Live results
Updated: Nov. 5, 10:35 AM ET
| Candidate | Party | % | Total Votes | |
|---|---|---|---|---|
| Ronny Jackson* | Republican party | 86% | 1,026 |
| Mark Nair | Democrat party | 14% | 169 |
Briscoe County
Live results
Updated: Nov. 5, 10:35 AM ET
| Candidate | Party | % | Total Votes | |
|---|---|---|---|---|
| Ronny Jackson* | Republican party | 88% | 522 |
| Mark Nair | Democrat party | 12% | 74 |
Carson County
Live results
Updated: Nov. 5, 10:35 AM ET
| Candidate | Party | % | Total Votes | |
|---|---|---|---|---|
| Ronny Jackson* | Republican party | 87% | 2,048 |
| Mark Nair | Democrat party | 13% | 316 |
Childress County
Live results
Updated: Nov. 5, 10:35 AM ET
| Candidate | Party | % | Total Votes | |
|---|---|---|---|---|
| Ronny Jackson* | Republican party | 83% | 312 |
| Mark Nair | Democrat party | 17% | 64 |
Clay County
Live results
Updated: Nov. 5, 10:35 AM ET
| Candidate | Party | % | Total Votes | |
|---|---|---|---|---|
| Ronny Jackson* | Republican party | 87% | 4,027 |
| Mark Nair | Democrat party | 13% | 598 |
Collingsworth County
Live results
Updated: Nov. 5, 10:35 AM ET
| Candidate | Party | % | Total Votes | |
|---|---|---|---|---|
| Ronny Jackson* | Republican party | 87% | 824 |
| Mark Nair | Democrat party | 13% | 121 |
Cottle County
Live results
Updated: Nov. 5, 10:35 AM ET
| Candidate | Party | % | Total Votes | |
|---|---|---|---|---|
| Ronny Jackson* | Republican party | 83% | 443 |
| Mark Nair | Democrat party | 17% | 88 |
Dallam County
Live results
Updated: Nov. 5, 10:35 AM ET
| Candidate | Party | % | Total Votes | |
|---|---|---|---|---|
| Ronny Jackson* | Republican party | 79% | 794 |
| Mark Nair | Democrat party | 21% | 208 |
Deaf Smith County
Live results
Updated: Nov. 5, 10:35 AM ET
| Candidate | Party | % | Total Votes | |
|---|---|---|---|---|
| Ronny Jackson* | Republican party | 63% | 2,191 |
| Mark Nair | Democrat party | 37% | 1,314 |
Denton County
Live results
Updated: Nov. 5, 10:35 AM ET
| Candidate | Party | % | Total Votes | |
|---|---|---|---|---|
| Mark Nair | Democrat party | 63% | 37,067 |
| Ronny Jackson* | Republican party | 37% | 22,085 |
Dickens County
Live results
Updated: Nov. 5, 10:35 AM ET
| Candidate | Party | % | Total Votes | |
|---|---|---|---|---|
| Ronny Jackson* | Republican party | 84% | 632 |
| Mark Nair | Democrat party | 16% | 116 |
Donley County
Live results
Updated: Nov. 5, 10:35 AM ET
| Candidate | Party | % | Total Votes | |
|---|---|---|---|---|
| Ronny Jackson* | Republican party | 88% | 1,124 |
| Mark Nair | Democrat party | 12% | 148 |
Foard County
Live results
Updated: Nov. 5, 10:35 AM ET
| Candidate | Party | % | Total Votes | |
|---|---|---|---|---|
| Ronny Jackson* | Republican party | 80% | 325 |
| Mark Nair | Democrat party | 20% | 80 |
Gray County
Live results
Updated: Nov. 5, 10:35 AM ET
| Candidate | Party | % | Total Votes | |
|---|---|---|---|---|
| Ronny Jackson* | Republican party | 83% | 4,538 |
| Mark Nair | Democrat party | 17% | 951 |
Hall County
Live results
Updated: Nov. 5, 10:35 AM ET
| Candidate | Party | % | Total Votes | |
|---|---|---|---|---|
| Ronny Jackson* | Republican party | 84% | 688 |
| Mark Nair | Democrat party | 16% | 127 |
Hansford County
Live results
Updated: Nov. 5, 10:35 AM ET
| Candidate | Party | % | Total Votes | |
|---|---|---|---|---|
| Ronny Jackson* | Republican party | 86% | 1,277 |
| Mark Nair | Democrat party | 14% | 200 |
Hardeman County
Live results
Updated: Nov. 5, 10:35 AM ET
| Candidate | Party | % | Total Votes | |
|---|---|---|---|---|
| Ronny Jackson* | Republican party | 79% | 814 |
| Mark Nair | Democrat party | 21% | 217 |
Hartley County
Live results
Updated: Nov. 5, 10:35 AM ET
| Candidate | Party | % | Total Votes | |
|---|---|---|---|---|
| Ronny Jackson* | Republican party | 88% | 1,353 |
| Mark Nair | Democrat party | 12% | 182 |
Hemphill County
Live results
Updated: Nov. 5, 10:35 AM ET
| Candidate | Party | % | Total Votes | |
|---|---|---|---|---|
| Ronny Jackson* | Republican party | 83% | 1,029 |
| Mark Nair | Democrat party | 17% | 207 |
Hutchinson County
Live results
Updated: Nov. 5, 10:35 AM ET
| Candidate | Party | % | Total Votes | |
|---|---|---|---|---|
| Ronny Jackson* | Republican party | 84% | 5,056 |
| Mark Nair | Democrat party | 16% | 985 |
King County
Live results
Updated: Nov. 5, 10:35 AM ET
| Candidate | Party | % | Total Votes | |
|---|---|---|---|---|
| Ronny Jackson* | Republican party | 92% | 106 |
| Mark Nair | Democrat party | 8% | 9 |
Knox County
Live results
Updated: Nov. 5, 10:35 AM ET
| Candidate | Party | % | Total Votes | |
|---|---|---|---|---|
| Ronny Jackson* | Republican party | 79% | 790 |
| Mark Nair | Democrat party | 21% | 205 |
Lipscomb County
Live results
Updated: Nov. 5, 10:35 AM ET
| Candidate | Party | % | Total Votes | |
|---|---|---|---|---|
| Ronny Jackson* | Republican party | 87% | 817 |
| Mark Nair | Democrat party | 13% | 117 |
Montague County
Live results
Updated: Nov. 5, 10:35 AM ET
| Candidate | Party | % | Total Votes | |
|---|---|---|---|---|
| Ronny Jackson* | Republican party | 86% | 7,437 |
| Mark Nair | Democrat party | 14% | 1,191 |
Moore County
Live results
Updated: Nov. 5, 10:35 AM ET
| Candidate | Party | % | Total Votes | |
|---|---|---|---|---|
| Ronny Jackson* | Republican party | 71% | 2,862 |
| Mark Nair | Democrat party | 29% | 1,196 |
Motley County
Live results
Updated: Nov. 5, 10:35 AM ET
| Candidate | Party | % | Total Votes | |
|---|---|---|---|---|
| Ronny Jackson* | Republican party | 93% | 476 |
| Mark Nair | Democrat party | 7% | 35 |
Ochiltree County
Live results
Updated: Nov. 5, 10:35 AM ET
| Candidate | Party | % | Total Votes | |
|---|---|---|---|---|
| Ronny Jackson* | Republican party | 81% | 1,865 |
| Mark Nair | Democrat party | 19% | 451 |
Oldham County
Live results
Updated: Nov. 5, 10:35 AM ET
| Candidate | Party | % | Total Votes | |
|---|---|---|---|---|
| Ronny Jackson* | Republican party | 90% | 669 |
| Mark Nair | Democrat party | 10% | 73 |
Potter County
Live results
Updated: Nov. 5, 10:35 AM ET
| Candidate | Party | % | Total Votes | |
|---|---|---|---|---|
| Ronny Jackson* | Republican party | 63% | 16,106 |
| Mark Nair | Democrat party | 37% | 9,552 |
Randall County
Live results
Updated: Nov. 5, 10:35 AM ET
| Candidate | Party | % | Total Votes | |
|---|---|---|---|---|
| Ronny Jackson* | Republican party | 74% | 39,356 |
| Mark Nair | Democrat party | 26% | 13,790 |
Roberts County
Live results
Updated: Nov. 5, 10:35 AM ET
| Candidate | Party | % | Total Votes | |
|---|---|---|---|---|
| Ronny Jackson* | Republican party | 96% | 433 |
| Mark Nair | Democrat party | 4% | 19 |
Sherman County
Live results
Updated: Nov. 5, 10:35 AM ET
| Candidate | Party | % | Total Votes | |
|---|---|---|---|---|
| Ronny Jackson* | Republican party | 85% | 601 |
| Mark Nair | Democrat party | 15% | 104 |
Wheeler County
Live results
Updated: Nov. 5, 10:35 AM ET
| Candidate | Party | % | Total Votes | |
|---|---|---|---|---|
| Ronny Jackson* | Republican party | 90% | 1,522 |
| Mark Nair | Democrat party | 10% | 172 |
Wichita County
Live results
Updated: Nov. 5, 10:35 AM ET
| Candidate | Party | % | Total Votes | |
|---|---|---|---|---|
| Ronny Jackson* | Republican party | 66% | 22,550 |
| Mark Nair | Democrat party | 34% | 11,837 |
Wilbarger County
Live results
Updated: Nov. 5, 10:35 AM ET
| Candidate | Party | % | Total Votes | |
|---|---|---|---|---|
| Ronny Jackson* | Republican party | 76% | 2,544 |
| Mark Nair | Democrat party | 24% | 818 |
Wise County
Live results
Updated: Nov. 5, 3:06 PM ET
| Candidate | Party | % | Total Votes | |
|---|---|---|---|---|
| Ronny Jackson* | Republican party | 85% | 4,581 |
| Mark Nair | Democrat party | 15% | 832 |
Texas District 14
Brazoria County
Live results
Updated: Nov. 5, 3:05 PM ET
| Candidate | Party | % | Total Votes | |
|---|---|---|---|---|
 | Thurman Bartie | Democrat party | 56% | 30,326 |
 | Randy Weber* | Republican party | 44% | 23,800 |
Chambers County
Live results
Updated: Nov. 5, 10:35 AM ET
| Candidate | Party | % | Total Votes | |
|---|---|---|---|---|
| Thurman Bartie | Democrat party | 0% | 0 |
| Randy Weber* | Republican party | 0% | 0 |
Fort Bend County
Live results
Updated: Nov. 5, 11:01 AM ET
| Candidate | Party | % | Total Votes | |
|---|---|---|---|---|
| Thurman Bartie | Democrat party | 64% | 20,543 |
| Randy Weber* | Republican party | 36% | 11,313 |
Galveston County
Live results
Updated: Nov. 5, 10:35 AM ET
| Candidate | Party | % | Total Votes | |
|---|---|---|---|---|
| Randy Weber* | Republican party | 57% | 76,494 |
| Thurman Bartie | Democrat party | 43% | 57,459 |
Jefferson County
Live results
Updated: Nov. 5, 10:35 AM ET
| Candidate | Party | % | Total Votes | |
|---|---|---|---|---|
| Randy Weber* | Republican party | 56% | 20,439 |
| Thurman Bartie | Democrat party | 44% | 15,959 |
Orange County
Live results
Updated: Nov. 5, 10:35 AM ET
| Candidate | Party | % | Total Votes | |
|---|---|---|---|---|
| Randy Weber* | Republican party | 78% | 20,573 |
| Thurman Bartie | Democrat party | 22% | 5,647 |
Texas District 15
Aransas County
Live results
Updated: Nov. 5, 10:35 AM ET
| Candidate | Party | % | Total Votes | |
|---|---|---|---|---|
 | Monica De La Cruz* | Republican party | 74% | 6,022 |
 | Bobby Pulido | Democrat party | 26% | 2,157 |
Bee County
Live results
Updated: Nov. 5, 10:35 AM ET
| Candidate | Party | % | Total Votes | |
|---|---|---|---|---|
| Monica De La Cruz* | Republican party | 56% | 3,995 |
| Bobby Pulido | Democrat party | 44% | 3,125 |
Brooks County
Live results
Updated: Nov. 5, 10:35 AM ET
| Candidate | Party | % | Total Votes | |
|---|---|---|---|---|
| Bobby Pulido | Democrat party | 73% | 1,344 |
| Monica De La Cruz* | Republican party | 27% | 502 |
DeWitt County
Live results
Updated: Nov. 5, 3:05 PM ET
| Candidate | Party | % | Total Votes | |
|---|---|---|---|---|
| Monica De La Cruz* | Republican party | 78% | 4,856 |
| Bobby Pulido | Democrat party | 22% | 1,334 |
Goliad County
Live results
Updated: Nov. 5, 10:35 AM ET
| Candidate | Party | % | Total Votes | |
|---|---|---|---|---|
| Monica De La Cruz* | Republican party | 74% | 2,456 |
| Bobby Pulido | Democrat party | 26% | 873 |
Gonzales County
Live results
Updated: Nov. 5, 10:35 AM ET
| Candidate | Party | % | Total Votes | |
|---|---|---|---|---|
| Monica De La Cruz* | Republican party | 66% | 4,380 |
| Bobby Pulido | Democrat party | 34% | 2,259 |
Hidalgo County
Live results
Updated: Nov. 5, 10:35 AM ET
| Candidate | Party | % | Total Votes | |
|---|---|---|---|---|
| Bobby Pulido | Democrat party | 74% | 100,719 |
| Monica De La Cruz* | Republican party | 26% | 34,701 |
Jim Wells County
Live results
Updated: Nov. 5, 10:35 AM ET
| Candidate | Party | % | Total Votes | |
|---|---|---|---|---|
| Bobby Pulido | Democrat party | 60% | 6,448 |
| Monica De La Cruz* | Republican party | 40% | 4,299 |
Lavaca County
Live results
Updated: Nov. 5, 10:35 AM ET
| Candidate | Party | % | Total Votes | |
|---|---|---|---|---|
| Monica De La Cruz* | Republican party | 84% | 7,145 |
| Bobby Pulido | Democrat party | 16% | 1,315 |
Refugio County
Live results
Updated: Nov. 5, 10:35 AM ET
| Candidate | Party | % | Total Votes | |
|---|---|---|---|---|
| Monica De La Cruz* | Republican party | 64% | 1,328 |
| Bobby Pulido | Democrat party | 36% | 744 |
San Patricio County
Live results
Updated: Nov. 5, 3:06 PM ET
| Candidate | Party | % | Total Votes | |
|---|---|---|---|---|
| Monica De La Cruz* | Republican party | 53% | 6,621 |
| Bobby Pulido | Democrat party | 47% | 5,886 |
Texas District 16
El Paso County
Live results
Updated: Nov. 5, 10:35 AM ET
| Candidate | Party | % | Total Votes | |
|---|---|---|---|---|
 | Veronica Escobar* | Democrat party | 71% | 138,543 |
 | Adam Bauman | Republican party | 29% | 57,247 |
Texas District 17
Bell County
Live results
Updated: Nov. 5, 10:35 AM ET
| Candidate | Party | % | Total Votes | |
|---|---|---|---|---|
 | Pete Sessions* | Republican party | 59% | 6,343 |
 | Casey Shepard | Democrat party | 41% | 4,376 |
Bosque County
Live results
Updated: Nov. 5, 10:35 AM ET
| Candidate | Party | % | Total Votes | |
|---|---|---|---|---|
| Pete Sessions* | Republican party | 81% | 6,196 |
| Casey Shepard | Democrat party | 19% | 1,475 |
Falls County
Live results
Updated: Nov. 5, 10:35 AM ET
| Candidate | Party | % | Total Votes | |
|---|---|---|---|---|
| Pete Sessions* | Republican party | 68% | 3,349 |
| Casey Shepard | Democrat party | 32% | 1,571 |
Freestone County
Live results
Updated: Nov. 5, 10:35 AM ET
| Candidate | Party | % | Total Votes | |
|---|---|---|---|---|
| Pete Sessions* | Republican party | 78% | 5,712 |
| Casey Shepard | Democrat party | 22% | 1,579 |
Hill County
Live results
Updated: Nov. 5, 10:35 AM ET
| Candidate | Party | % | Total Votes | |
|---|---|---|---|---|
| Pete Sessions* | Republican party | 77% | 10,087 |
| Casey Shepard | Democrat party | 23% | 2,981 |
Johnson County
Live results
Updated: Nov. 5, 10:35 AM ET
| Candidate | Party | % | Total Votes | |
|---|---|---|---|---|
| Pete Sessions* | Republican party | 78% | 5,958 |
| Casey Shepard | Democrat party | 22% | 1,705 |
Limestone County
Live results
Updated: Nov. 5, 10:35 AM ET
| Candidate | Party | % | Total Votes | |
|---|---|---|---|---|
| Pete Sessions* | Republican party | 72% | 5,207 |
| Casey Shepard | Democrat party | 28% | 1,987 |
McLennan County
Live results
Updated: Nov. 5, 10:35 AM ET
| Candidate | Party | % | Total Votes | |
|---|---|---|---|---|
| Pete Sessions* | Republican party | 59% | 48,833 |
| Casey Shepard | Democrat party | 41% | 33,578 |
Milam County
Live results
Updated: Nov. 5, 10:35 AM ET
| Candidate | Party | % | Total Votes | |
|---|---|---|---|---|
| Pete Sessions* | Republican party | 74% | 6,319 |
| Casey Shepard | Democrat party | 26% | 2,265 |
Robertson County
Live results
Updated: Nov. 5, 10:35 AM ET
| Candidate | Party | % | Total Votes | |
|---|---|---|---|---|
| Pete Sessions* | Republican party | 70% | 4,838 |
| Casey Shepard | Democrat party | 30% | 2,068 |
Williamson County
Live results
Updated: Nov. 5, 2:40 PM ET
| Candidate | Party | % | Total Votes | |
|---|---|---|---|---|
| Casey Shepard | Democrat party | 64% | 70,895 |
| Pete Sessions* | Republican party | 36% | 40,681 |
Texas District 18
Fort Bend County
Live results
Updated: Nov. 5, 11:01 AM ET
| Candidate | Party | % | Total Votes | |
|---|---|---|---|---|
 | Christian Menefee* | Democrat party | 83% | 43,507 |
 | Ronald Whitfield | Republican party | 17% | 9,075 |
Harris County
Live results
Updated: Nov. 5, 10:35 AM ET
| Candidate | Party | % | Total Votes | |
|---|---|---|---|---|
| Christian Menefee* | Democrat party | 87% | 149,642 |
| Ronald Whitfield | Republican party | 13% | 22,259 |
Texas District 19
Andrews County
Live results
Updated: Nov. 5, 10:35 AM ET
| Candidate | Party | % | Total Votes | |
|---|---|---|---|---|
 | Tom Sell | Republican party | 76% | 3,129 |
 | Kyle Rable | Democrat party | 24% | 963 |
Bailey County
Live results
Updated: Nov. 5, 10:35 AM ET
| Candidate | Party | % | Total Votes | |
|---|---|---|---|---|
| Tom Sell | Republican party | 71% | 995 |
| Kyle Rable | Democrat party | 29% | 404 |
Borden County
Live results
Updated: Nov. 5, 10:35 AM ET
| Candidate | Party | % | Total Votes | |
|---|---|---|---|---|
| Tom Sell | Republican party | 96% | 296 |
| Kyle Rable | Democrat party | 4% | 12 |
Callahan County
Live results
Updated: Nov. 5, 10:35 AM ET
| Candidate | Party | % | Total Votes | |
|---|---|---|---|---|
| Tom Sell | Republican party | 87% | 508 |
| Kyle Rable | Democrat party | 13% | 77 |
Castro County
Live results
Updated: Nov. 5, 10:35 AM ET
| Candidate | Party | % | Total Votes | |
|---|---|---|---|---|
| Tom Sell | Republican party | 75% | 1,142 |
| Kyle Rable | Democrat party | 25% | 371 |
Cochran County
Live results
Updated: Nov. 5, 10:35 AM ET
| Candidate | Party | % | Total Votes | |
|---|---|---|---|---|
| Tom Sell | Republican party | 76% | 523 |
| Kyle Rable | Democrat party | 24% | 168 |
Crosby County
Live results
Updated: Nov. 5, 10:35 AM ET
| Candidate | Party | % | Total Votes | |
|---|---|---|---|---|
| Tom Sell | Republican party | 69% | 1,021 |
| Kyle Rable | Democrat party | 31% | 453 |
Dawson County
Live results
Updated: Nov. 5, 10:35 AM ET
| Candidate | Party | % | Total Votes | |
|---|---|---|---|---|
| Tom Sell | Republican party | 75% | 1,933 |
| Kyle Rable | Democrat party | 25% | 630 |
Fisher County
Live results
Updated: Nov. 5, 10:35 AM ET
| Candidate | Party | % | Total Votes | |
|---|---|---|---|---|
| Tom Sell | Republican party | 81% | 1,132 |
| Kyle Rable | Democrat party | 19% | 267 |
Floyd County
Live results
Updated: Nov. 5, 10:35 AM ET
| Candidate | Party | % | Total Votes | |
|---|---|---|---|---|
| Tom Sell | Republican party | 76% | 1,241 |
| Kyle Rable | Democrat party | 24% | 389 |
Gaines County
Live results
Updated: Nov. 5, 10:35 AM ET
| Candidate | Party | % | Total Votes | |
|---|---|---|---|---|
| Tom Sell | Republican party | 85% | 4,077 |
| Kyle Rable | Democrat party | 15% | 711 |
Garza County
Live results
Updated: Nov. 5, 10:35 AM ET
| Candidate | Party | % | Total Votes | |
|---|---|---|---|---|
| Tom Sell | Republican party | 83% | 954 |
| Kyle Rable | Democrat party | 17% | 198 |
Hale County
Live results
Updated: Nov. 5, 10:35 AM ET
| Candidate | Party | % | Total Votes | |
|---|---|---|---|---|
| Tom Sell | Republican party | 69% | 5,211 |
| Kyle Rable | Democrat party | 31% | 2,325 |
Haskell County
Live results
Updated: Nov. 5, 10:35 AM ET
| Candidate | Party | % | Total Votes | |
|---|---|---|---|---|
| Tom Sell | Republican party | 84% | 1,352 |
| Kyle Rable | Democrat party | 16% | 250 |
Hockley County
Live results
Updated: Nov. 5, 10:35 AM ET
| Candidate | Party | % | Total Votes | |
|---|---|---|---|---|
| Tom Sell | Republican party | 77% | 4,930 |
| Kyle Rable | Democrat party | 23% | 1,469 |
Howard County
Live results
Updated: Nov. 5, 10:35 AM ET
| Candidate | Party | % | Total Votes | |
|---|---|---|---|---|
| Tom Sell | Republican party | 74% | 5,161 |
| Kyle Rable | Democrat party | 26% | 1,810 |
Jones County
Live results
Updated: Nov. 5, 10:35 AM ET
| Candidate | Party | % | Total Votes | |
|---|---|---|---|---|
| Tom Sell | Republican party | 83% | 4,322 |
| Kyle Rable | Democrat party | 17% | 892 |
Kent County
Live results
Updated: Nov. 5, 10:35 AM ET
| Candidate | Party | % | Total Votes | |
|---|---|---|---|---|
| Tom Sell | Republican party | 90% | 302 |
| Kyle Rable | Democrat party | 10% | 35 |
Lamb County
Live results
Updated: Nov. 5, 10:35 AM ET
| Candidate | Party | % | Total Votes | |
|---|---|---|---|---|
| Tom Sell | Republican party | 77% | 2,533 |
| Kyle Rable | Democrat party | 23% | 744 |
Lubbock County
Live results
Updated: Nov. 5, 3:05 PM ET
| Candidate | Party | % | Total Votes | |
|---|---|---|---|---|
| Tom Sell | Republican party | 63% | 64,504 |
| Kyle Rable | Democrat party | 37% | 38,002 |
Lynn County
Live results
Updated: Nov. 5, 10:35 AM ET
| Candidate | Party | % | Total Votes | |
|---|---|---|---|---|
| Tom Sell | Republican party | 81% | 1,720 |
| Kyle Rable | Democrat party | 19% | 391 |
Martin County
Live results
Updated: Nov. 5, 10:35 AM ET
| Candidate | Party | % | Total Votes | |
|---|---|---|---|---|
| Tom Sell | Republican party | 83% | 1,221 |
| Kyle Rable | Democrat party | 17% | 256 |
Mitchell County
Live results
Updated: Nov. 5, 10:35 AM ET
| Candidate | Party | % | Total Votes | |
|---|---|---|---|---|
| Tom Sell | Republican party | 83% | 1,540 |
| Kyle Rable | Democrat party | 17% | 310 |
Nolan County
Live results
Updated: Nov. 5, 10:35 AM ET
| Candidate | Party | % | Total Votes | |
|---|---|---|---|---|
| Tom Sell | Republican party | 75% | 2,790 |
| Kyle Rable | Democrat party | 25% | 908 |
Parmer County
Live results
Updated: Nov. 5, 10:35 AM ET
| Candidate | Party | % | Total Votes | |
|---|---|---|---|---|
| Tom Sell | Republican party | 76% | 1,484 |
| Kyle Rable | Democrat party | 24% | 473 |
Scurry County
Live results
Updated: Nov. 5, 10:35 AM ET
| Candidate | Party | % | Total Votes | |
|---|---|---|---|---|
| Tom Sell | Republican party | 83% | 3,454 |
| Kyle Rable | Democrat party | 17% | 683 |
Shackelford County
Live results
Updated: Nov. 5, 10:35 AM ET
| Candidate | Party | % | Total Votes | |
|---|---|---|---|---|
| Tom Sell | Republican party | 91% | 1,177 |
| Kyle Rable | Democrat party | 9% | 113 |
Stonewall County
Live results
Updated: Nov. 5, 10:35 AM ET
| Candidate | Party | % | Total Votes | |
|---|---|---|---|---|
| Tom Sell | Republican party | 83% | 423 |
| Kyle Rable | Democrat party | 17% | 88 |
Swisher County
Live results
Updated: Nov. 5, 10:35 AM ET
| Candidate | Party | % | Total Votes | |
|---|---|---|---|---|
| Tom Sell | Republican party | 76% | 1,302 |
| Kyle Rable | Democrat party | 24% | 400 |
Taylor County
Live results
Updated: Nov. 5, 10:35 AM ET
| Candidate | Party | % | Total Votes | |
|---|---|---|---|---|
| Tom Sell | Republican party | 70% | 29,855 |
| Kyle Rable | Democrat party | 30% | 12,748 |
Terry County
Live results
Updated: Nov. 5, 10:35 AM ET
| Candidate | Party | % | Total Votes | |
|---|---|---|---|---|
| Tom Sell | Republican party | 75% | 1,952 |
| Kyle Rable | Democrat party | 25% | 637 |
Throckmorton County
Live results
Updated: Nov. 5, 10:35 AM ET
| Candidate | Party | % | Total Votes | |
|---|---|---|---|---|
| Tom Sell | Republican party | 90% | 565 |
| Kyle Rable | Democrat party | 10% | 65 |
Yoakum County
Live results
Updated: Nov. 5, 10:35 AM ET
| Candidate | Party | % | Total Votes | |
|---|---|---|---|---|
| Tom Sell | Republican party | 75% | 1,330 |
| Kyle Rable | Democrat party | 25% | 432 |
Texas District 20
Bexar County
Live results
Updated: Nov. 5, 10:35 AM ET
| Candidate | Party | % | Total Votes | |
|---|---|---|---|---|
 | Joaquin Castro* | Democrat party | 78% | 149,397 |
 | Edgardo Baez | Republican party | 22% | 43,097 |
Texas District 21
Bandera County
Live results
Updated: Nov. 5, 10:35 AM ET
| Candidate | Party | % | Total Votes | |
|---|---|---|---|---|
 | Mark Teixeira | Republican party | 78% | 7,949 |
 | Kristin Hook | Democrat party | 22% | 2,216 |
Bexar County
Live results
Updated: Nov. 5, 10:35 AM ET
| Candidate | Party | % | Total Votes | |
|---|---|---|---|---|
| Kristin Hook | Democrat party | 61% | 79,678 |
| Mark Teixeira | Republican party | 39% | 51,791 |
Blanco County
Live results
Updated: Nov. 5, 10:35 AM ET
| Candidate | Party | % | Total Votes | |
|---|---|---|---|---|
| Mark Teixeira | Republican party | 74% | 5,526 |
| Kristin Hook | Democrat party | 26% | 1,979 |
Comal County
Live results
Updated: Nov. 5, 10:35 AM ET
| Candidate | Party | % | Total Votes | |
|---|---|---|---|---|
| Mark Teixeira | Republican party | 67% | 59,691 |
| Kristin Hook | Democrat party | 33% | 28,833 |
Gillespie County
Live results
Updated: Nov. 5, 10:35 AM ET
| Candidate | Party | % | Total Votes | |
|---|---|---|---|---|
| Mark Teixeira | Republican party | 77% | 11,150 |
| Kristin Hook | Democrat party | 23% | 3,322 |
Hays County
Live results
Updated: Nov. 5, 3:06 PM ET
| Candidate | Party | % | Total Votes | |
|---|---|---|---|---|
| Kristin Hook | Democrat party | 61% | 32,797 |
| Mark Teixeira | Republican party | 39% | 20,855 |
Kendall County
Live results
Updated: Nov. 5, 10:35 AM ET
| Candidate | Party | % | Total Votes | |
|---|---|---|---|---|
| Mark Teixeira | Republican party | 75% | 19,288 |
| Kristin Hook | Democrat party | 25% | 6,557 |
Kerr County
Live results
Updated: Nov. 5, 3:04 PM ET
| Candidate | Party | % | Total Votes | |
|---|---|---|---|---|
| Mark Teixeira | Republican party | 72% | 16,851 |
| Kristin Hook | Democrat party | 28% | 6,429 |
Real County
Live results
Updated: Nov. 5, 10:35 AM ET
| Candidate | Party | % | Total Votes | |
|---|---|---|---|---|
| Mark Teixeira | Republican party | 81% | 1,201 |
| Kristin Hook | Democrat party | 19% | 277 |
Texas District 22
Brazoria County
Live results
Updated: Nov. 5, 3:05 PM ET
| Candidate | Party | % | Total Votes | |
|---|---|---|---|---|
 | Trever Nehls | Republican party | 67% | 34,454 |
 | Marquette Greene-Scott | Democrat party | 33% | 16,898 |
Fort Bend County
Live results
Updated: Nov. 5, 11:01 AM ET
| Candidate | Party | % | Total Votes | |
|---|---|---|---|---|
| Marquette Greene-Scott | Democrat party | 50% | 91,999 |
| Trever Nehls | Republican party | 50% | 91,231 |
Harris County
Live results
Updated: Nov. 5, 10:35 AM ET
| Candidate | Party | % | Total Votes | |
|---|---|---|---|---|
| Marquette Greene-Scott | Democrat party | 56% | 30,714 |
| Trever Nehls | Republican party | 44% | 24,481 |
Texas District 23
Bexar County
Live results
Updated: Nov. 5, 10:35 AM ET
| Candidate | Party | % | Total Votes | |
|---|---|---|---|---|
 | Katy Padilla Stout | Democrat party | 54% | 91,520 |
 | Brandon Herrera | Republican party | 42% | 70,945 |
Brewster County
Live results
Updated: Nov. 5, 10:35 AM ET
| Candidate | Party | % | Total Votes | |
|---|---|---|---|---|
| Katy Padilla Stout | Democrat party | 51% | 1,937 |
| Brandon Herrera | Republican party | 46% | 1,728 |
Crane County
Live results
Updated: Nov. 5, 10:35 AM ET
| Candidate | Party | % | Total Votes | |
|---|---|---|---|---|
| Brandon Herrera | Republican party | 73% | 728 |
| Katy Padilla Stout | Democrat party | 24% | 238 |
Crockett County
Live results
Updated: Nov. 5, 10:35 AM ET
| Candidate | Party | % | Total Votes | |
|---|---|---|---|---|
| Brandon Herrera | Republican party | 68% | 667 |
| Katy Padilla Stout | Democrat party | 29% | 281 |
Culberson County
Live results
Updated: Nov. 5, 10:35 AM ET
| Candidate | Party | % | Total Votes | |
|---|---|---|---|---|
| Katy Padilla Stout | Democrat party | 51% | 421 |
| Brandon Herrera | Republican party | 42% | 344 |
Edwards County
Live results
Updated: Nov. 5, 10:35 AM ET
| Candidate | Party | % | Total Votes | |
|---|---|---|---|---|
| Brandon Herrera | Republican party | 81% | 645 |
| Katy Padilla Stout | Democrat party | 17% | 136 |
El Paso County
Live results
Updated: Nov. 5, 10:35 AM ET
| Candidate | Party | % | Total Votes | |
|---|---|---|---|---|
| Katy Padilla Stout | Democrat party | 69% | 13,691 |
| Brandon Herrera | Republican party | 28% | 5,550 |
Frio County
Live results
Updated: Nov. 5, 10:35 AM ET
| Candidate | Party | % | Total Votes | |
|---|---|---|---|---|
| Katy Padilla Stout | Democrat party | 50% | 1,841 |
| Brandon Herrera | Republican party | 45% | 1,672 |
Hudspeth County
Live results
Updated: Nov. 5, 10:35 AM ET
| Candidate | Party | % | Total Votes | |
|---|---|---|---|---|
| Brandon Herrera | Republican party | 59% | 472 |
| Katy Padilla Stout | Democrat party | 37% | 291 |
Jeff Davis County
Live results
Updated: Nov. 5, 10:35 AM ET
| Candidate | Party | % | Total Votes | |
|---|---|---|---|---|
| Brandon Herrera | Republican party | 54% | 548 |
| Katy Padilla Stout | Democrat party | 41% | 414 |
Kinney County
Live results
Updated: Nov. 5, 10:35 AM ET
| Candidate | Party | % | Total Votes | |
|---|---|---|---|---|
| Brandon Herrera | Republican party | 67% | 793 |
| Katy Padilla Stout | Democrat party | 30% | 353 |
Loving County
Live results
Updated: Nov. 5, 10:35 AM ET
| Candidate | Party | % | Total Votes | |
|---|---|---|---|---|
| Brandon Herrera | Republican party | 83% | 53 |
| Katy Padilla Stout | Democrat party | 14% | 9 |
Maverick County
Live results
Updated: Nov. 5, 10:35 AM ET
| Candidate | Party | % | Total Votes | |
|---|---|---|---|---|
| Katy Padilla Stout | Democrat party | 65% | 6,714 |
| Brandon Herrera | Republican party | 30% | 3,120 |
Medina County
Live results
Updated: Nov. 5, 10:35 AM ET
| Candidate | Party | % | Total Votes | |
|---|---|---|---|---|
| Brandon Herrera | Republican party | 61% | 12,977 |
| Katy Padilla Stout | Democrat party | 34% | 7,222 |
Pecos County
Live results
Updated: Nov. 5, 10:35 AM ET
| Candidate | Party | % | Total Votes | |
|---|---|---|---|---|
| Brandon Herrera | Republican party | 58% | 1,896 |
| Katy Padilla Stout | Democrat party | 38% | 1,254 |
Presidio County
Live results
Updated: Nov. 5, 10:35 AM ET
| Candidate | Party | % | Total Votes | |
|---|---|---|---|---|
| Katy Padilla Stout | Democrat party | 70% | 1,371 |
| Brandon Herrera | Republican party | 7% | 140 |
Reagan County
Live results
Updated: Nov. 5, 10:35 AM ET
| Candidate | Party | % | Total Votes | |
|---|---|---|---|---|
| Brandon Herrera | Republican party | 72% | 496 |
| Katy Padilla Stout | Democrat party | 24% | 168 |
Reeves County
Live results
Updated: Nov. 5, 10:35 AM ET
| Candidate | Party | % | Total Votes | |
|---|---|---|---|---|
| Brandon Herrera | Republican party | 51% | 1,495 |
| Katy Padilla Stout | Democrat party | 43% | 1,267 |
Schleicher County
Live results
Updated: Nov. 5, 10:35 AM ET
| Candidate | Party | % | Total Votes | |
|---|---|---|---|---|
| Brandon Herrera | Republican party | 75% | 679 |
| Katy Padilla Stout | Democrat party | 23% | 208 |
Sutton County
Live results
Updated: Nov. 5, 10:35 AM ET
| Candidate | Party | % | Total Votes | |
|---|---|---|---|---|
| Brandon Herrera | Republican party | 76% | 821 |
| Katy Padilla Stout | Democrat party | 22% | 239 |
Terrell County
Live results
Updated: Nov. 5, 10:35 AM ET
| Candidate | Party | % | Total Votes | |
|---|---|---|---|---|
| Brandon Herrera | Republican party | 72% | 235 |
| Katy Padilla Stout | Democrat party | 24% | 77 |
Upton County
Live results
Updated: Nov. 5, 10:35 AM ET
| Candidate | Party | % | Total Votes | |
|---|---|---|---|---|
| Brandon Herrera | Republican party | 79% | 672 |
| Katy Padilla Stout | Democrat party | 17% | 142 |
Uvalde County
Live results
Updated: Nov. 5, 10:35 AM ET
| Candidate | Party | % | Total Votes | |
|---|---|---|---|---|
| Brandon Herrera | Republican party | 52% | 4,260 |
| Katy Padilla Stout | Democrat party | 43% | 3,527 |
Val Verde County
Live results
Updated: Nov. 5, 10:35 AM ET
| Candidate | Party | % | Total Votes | |
|---|---|---|---|---|
| Katy Padilla Stout | Democrat party | 50% | 5,737 |
| Brandon Herrera | Republican party | 46% | 5,274 |
Ward County
Live results
Updated: Nov. 5, 10:35 AM ET
| Candidate | Party | % | Total Votes | |
|---|---|---|---|---|
| Brandon Herrera | Republican party | 73% | 1,846 |
| Katy Padilla Stout | Democrat party | 24% | 595 |
Winkler County
Live results
Updated: Nov. 5, 10:35 AM ET
| Candidate | Party | % | Total Votes | |
|---|---|---|---|---|
| Brandon Herrera | Republican party | 73% | 967 |
| Katy Padilla Stout | Democrat party | 25% | 327 |
Zavala County
Live results
Updated: Nov. 5, 10:35 AM ET
| Candidate | Party | % | Total Votes | |
|---|---|---|---|---|
| Katy Padilla Stout | Democrat party | 70% | 2,052 |
| Brandon Herrera | Republican party | 26% | 772 |
Texas District 24
Dallas County
Live results
Updated: Nov. 5, 10:35 AM ET
| Candidate | Party | % | Total Votes | |
|---|---|---|---|---|
 | Beth Van Duyne* | Republican party | 51% | 51,958 |
 | Kevin Burge | Democrat party | 49% | 49,893 |
Tarrant County
Live results
Updated: Nov. 5, 10:35 AM ET
| Candidate | Party | % | Total Votes | |
|---|---|---|---|---|
| Beth Van Duyne* | Republican party | 55% | 119,793 |
| Kevin Burge | Democrat party | 45% | 99,804 |
Texas District 25
Callahan County
Live results
Updated: Nov. 5, 10:35 AM ET
| Candidate | Party | % | Total Votes | |
|---|---|---|---|---|
 | Roger Williams* | Republican party | 86% | 4,119 |
 | Dione Sims | Democrat party | 14% | 654 |
Comanche County
Live results
Updated: Nov. 5, 10:35 AM ET
| Candidate | Party | % | Total Votes | |
|---|---|---|---|---|
| Roger Williams* | Republican party | 83% | 4,228 |
| Dione Sims | Democrat party | 17% | 880 |
Eastland County
Live results
Updated: Nov. 5, 10:35 AM ET
| Candidate | Party | % | Total Votes | |
|---|---|---|---|---|
| Roger Williams* | Republican party | 85% | 5,399 |
| Dione Sims | Democrat party | 15% | 933 |
Erath County
Live results
Updated: Nov. 5, 10:35 AM ET
| Candidate | Party | % | Total Votes | |
|---|---|---|---|---|
| Roger Williams* | Republican party | 78% | 10,919 |
| Dione Sims | Democrat party | 22% | 3,002 |
Hood County
Live results
Updated: Nov. 5, 3:03 PM ET
| Candidate | Party | % | Total Votes | |
|---|---|---|---|---|
| Roger Williams* | Republican party | 80% | 24,161 |
| Dione Sims | Democrat party | 20% | 5,952 |
Jack County
Live results
Updated: Nov. 5, 10:35 AM ET
| Candidate | Party | % | Total Votes | |
|---|---|---|---|---|
| Roger Williams* | Republican party | 89% | 2,990 |
| Dione Sims | Democrat party | 11% | 383 |
Johnson County
Live results
Updated: Nov. 5, 10:35 AM ET
| Candidate | Party | % | Total Votes | |
|---|---|---|---|---|
| Roger Williams* | Republican party | 69% | 16,919 |
| Dione Sims | Democrat party | 31% | 7,501 |
Palo Pinto County
Live results
Updated: Nov. 5, 10:35 AM ET
| Candidate | Party | % | Total Votes | |
|---|---|---|---|---|
| Roger Williams* | Republican party | 80% | 8,280 |
| Dione Sims | Democrat party | 20% | 2,114 |
Parker County
Live results
Updated: Nov. 5, 10:59 AM ET
| Candidate | Party | % | Total Votes | |
|---|---|---|---|---|
| Roger Williams* | Republican party | 80% | 15,904 |
| Dione Sims | Democrat party | 20% | 3,970 |
Somervell County
Live results
Updated: Nov. 5, 10:35 AM ET
| Candidate | Party | % | Total Votes | |
|---|---|---|---|---|
| Roger Williams* | Republican party | 84% | 3,600 |
| Dione Sims | Democrat party | 16% | 686 |
Stephens County
Live results
Updated: Nov. 5, 10:35 AM ET
| Candidate | Party | % | Total Votes | |
|---|---|---|---|---|
| Roger Williams* | Republican party | 86% | 2,370 |
| Dione Sims | Democrat party | 14% | 378 |
Tarrant County
Live results
Updated: Nov. 5, 10:35 AM ET
| Candidate | Party | % | Total Votes | |
|---|---|---|---|---|
| Dione Sims | Democrat party | 71% | 95,419 |
| Roger Williams* | Republican party | 29% | 38,272 |
Young County
Live results
Updated: Nov. 5, 10:35 AM ET
| Candidate | Party | % | Total Votes | |
|---|---|---|---|---|
| Roger Williams* | Republican party | 85% | 5,560 |
| Dione Sims | Democrat party | 15% | 982 |
Texas District 26
Cooke County
Live results
Updated: Nov. 5, 10:35 AM ET
| Candidate | Party | % | Total Votes | |
|---|---|---|---|---|
 | Brandon Gill* | Republican party | 78% | 13,336 |
 | Steven Shook | Democrat party | 21% | 3,505 |
Show More
Denton County
Live results
Updated: Nov. 5, 10:35 AM ET
| Candidate | Party | % | Total Votes | |
|---|---|---|---|---|
| Brandon Gill* | Republican party | 51% | 149,668 |
| Steven Shook | Democrat party | 48% | 139,056 |
Show More
Wise County
Live results
Updated: Nov. 5, 3:06 PM ET
| Candidate | Party | % | Total Votes | |
|---|---|---|---|---|
| Brandon Gill* | Republican party | 77% | 19,644 |
| Steven Shook | Democrat party | 21% | 5,383 |
Show More
Texas District 27
Aransas County
Live results
Updated: Nov. 5, 10:35 AM ET
| Candidate | Party | % | Total Votes | |
|---|---|---|---|---|
 | Michael Cloud* | Republican party | 76% | 1,744 |
 | Tanya Lloyd | Democrat party | 24% | 536 |
Austin County
Live results
Updated: Nov. 5, 10:35 AM ET
| Candidate | Party | % | Total Votes | |
|---|---|---|---|---|
| Michael Cloud* | Republican party | 76% | 9,684 |
| Tanya Lloyd | Democrat party | 24% | 2,977 |
Bastrop County
Live results
Updated: Nov. 5, 10:35 AM ET
| Candidate | Party | % | Total Votes | |
|---|---|---|---|---|
| Tanya Lloyd | Democrat party | 52% | 18,593 |
| Michael Cloud* | Republican party | 48% | 17,261 |
Caldwell County
Live results
Updated: Nov. 5, 10:35 AM ET
| Candidate | Party | % | Total Votes | |
|---|---|---|---|---|
| Tanya Lloyd | Democrat party | 56% | 8,213 |
| Michael Cloud* | Republican party | 44% | 6,407 |
Calhoun County
Live results
Updated: Nov. 5, 10:35 AM ET
| Candidate | Party | % | Total Votes | |
|---|---|---|---|---|
| Michael Cloud* | Republican party | 70% | 4,365 |
| Tanya Lloyd | Democrat party | 30% | 1,903 |
Colorado County
Live results
Updated: Nov. 5, 10:35 AM ET
| Candidate | Party | % | Total Votes | |
|---|---|---|---|---|
| Michael Cloud* | Republican party | 74% | 6,148 |
| Tanya Lloyd | Democrat party | 26% | 2,114 |
Fayette County
Live results
Updated: Nov. 5, 10:35 AM ET
| Candidate | Party | % | Total Votes | |
|---|---|---|---|---|
| Michael Cloud* | Republican party | 76% | 8,491 |
| Tanya Lloyd | Democrat party | 24% | 2,612 |
Hays County
Live results
Updated: Nov. 5, 3:06 PM ET
| Candidate | Party | % | Total Votes | |
|---|---|---|---|---|
| Tanya Lloyd | Democrat party | 64% | 41,376 |
| Michael Cloud* | Republican party | 36% | 22,788 |
Jackson County
Live results
Updated: Nov. 5, 10:35 AM ET
| Candidate | Party | % | Total Votes | |
|---|---|---|---|---|
| Michael Cloud* | Republican party | 81% | 4,035 |
| Tanya Lloyd | Democrat party | 19% | 951 |
Matagorda County
Live results
Updated: Nov. 5, 10:35 AM ET
| Candidate | Party | % | Total Votes | |
|---|---|---|---|---|
| Michael Cloud* | Republican party | 68% | 7,391 |
| Tanya Lloyd | Democrat party | 32% | 3,444 |
Nueces County
Live results
Updated: Nov. 5, 10:35 AM ET
| Candidate | Party | % | Total Votes | |
|---|---|---|---|---|
| Tanya Lloyd | Democrat party | 68% | 7,282 |
| Michael Cloud* | Republican party | 32% | 3,488 |
Refugio County
Live results
Updated: Nov. 5, 10:35 AM ET
| Candidate | Party | % | Total Votes | |
|---|---|---|---|---|
| Michael Cloud* | Republican party | 60% | 187 |
| Tanya Lloyd | Democrat party | 40% | 124 |
San Patricio County
Live results
Updated: Nov. 5, 3:06 PM ET
| Candidate | Party | % | Total Votes | |
|---|---|---|---|---|
| Michael Cloud* | Republican party | 67% | 5,026 |
| Tanya Lloyd | Democrat party | 33% | 2,437 |
Travis County
Live results
Updated: Nov. 5, 10:43 AM ET
| Candidate | Party | % | Total Votes | |
|---|---|---|---|---|
| Tanya Lloyd | Democrat party | 76% | 27,969 |
| Michael Cloud* | Republican party | 24% | 8,937 |
Victoria County
Live results
Updated: Nov. 5, 12:18 PM ET
| Candidate | Party | % | Total Votes | |
|---|---|---|---|---|
| Michael Cloud* | Republican party | 65% | 18,337 |
| Tanya Lloyd | Democrat party | 35% | 9,761 |
Washington County
Live results
Updated: Nov. 5, 10:35 AM ET
| Candidate | Party | % | Total Votes | |
|---|---|---|---|---|
| Michael Cloud* | Republican party | 74% | 11,377 |
| Tanya Lloyd | Democrat party | 26% | 3,947 |
Wharton County
Live results
Updated: Nov. 5, 10:35 AM ET
| Candidate | Party | % | Total Votes | |
|---|---|---|---|---|
| Michael Cloud* | Republican party | 70% | 8,805 |
| Tanya Lloyd | Democrat party | 30% | 3,689 |
Texas District 28
Atascosa County
Live results
Updated: Nov. 5, 10:35 AM ET
| Candidate | Party | % | Total Votes | |
|---|---|---|---|---|
 | Tano Tijerina | Republican party | 54% | 7,802 |
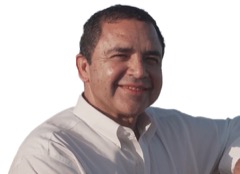 | Henry Cuellar* | Democrat party | 42% | 5,986 |
Show More
Dimmit County
Live results
Updated: Nov. 5, 10:35 AM ET
| Candidate | Party | % | Total Votes | |
|---|---|---|---|---|
| Henry Cuellar* | Democrat party | 66% | 1,675 |
| Tano Tijerina | Republican party | 31% | 779 |
Show More
Duval County
Live results
Updated: Nov. 5, 10:35 AM ET
| Candidate | Party | % | Total Votes | |
|---|---|---|---|---|
| Henry Cuellar* | Democrat party | 69% | 2,212 |
| Tano Tijerina | Republican party | 28% | 890 |
Show More
Hidalgo County
Live results
Updated: Nov. 5, 10:35 AM ET
| Candidate | Party | % | Total Votes | |
|---|---|---|---|---|
| Henry Cuellar* | Democrat party | 69% | 46,438 |
| Tano Tijerina | Republican party | 27% | 18,408 |
Show More
Jim Hogg County
Live results
Updated: Nov. 5, 10:35 AM ET
| Candidate | Party | % | Total Votes | |
|---|---|---|---|---|
| Henry Cuellar* | Democrat party | 77% | 1,039 |
| Tano Tijerina | Republican party | 22% | 295 |
Show More
La Salle County
Live results
Updated: Nov. 5, 10:35 AM ET
| Candidate | Party | % | Total Votes | |
|---|---|---|---|---|
| Henry Cuellar* | Democrat party | 55% | 1,022 |
| Tano Tijerina | Republican party | 41% | 764 |
Show More
Live Oak County
Live results
Updated: Nov. 5, 10:35 AM ET
| Candidate | Party | % | Total Votes | |
|---|---|---|---|---|
| Tano Tijerina | Republican party | 78% | 2,981 |
| Henry Cuellar* | Democrat party | 20% | 777 |
Show More
McMullen County
Live results
Updated: Nov. 5, 10:35 AM ET
| Candidate | Party | % | Total Votes | |
|---|---|---|---|---|
| Tano Tijerina | Republican party | 74% | 273 |
| Henry Cuellar* | Democrat party | 26% | 95 |
Show More
Maverick County
Live results
Updated: Nov. 5, 10:35 AM ET
| Candidate | Party | % | Total Votes | |
|---|---|---|---|---|
| Henry Cuellar* | Democrat party | 69% | 1,268 |
| Tano Tijerina | Republican party | 26% | 486 |
Show More
Starr County
Live results
Updated: Nov. 5, 10:35 AM ET
| Candidate | Party | % | Total Votes | |
|---|---|---|---|---|
| Henry Cuellar* | Democrat party | 78% | 10,504 |
| Tano Tijerina | Republican party | 20% | 2,640 |
Show More
Webb County
Live results
Updated: Nov. 5, 10:35 AM ET
| Candidate | Party | % | Total Votes | |
|---|---|---|---|---|
| Henry Cuellar* | Democrat party | 68% | 39,819 |
| Tano Tijerina | Republican party | 25% | 14,971 |
Show More
Zapata County
Live results
Updated: Nov. 5, 10:35 AM ET
| Candidate | Party | % | Total Votes | |
|---|---|---|---|---|
| Henry Cuellar* | Democrat party | 74% | 2,480 |
| Tano Tijerina | Republican party | 23% | 776 |
Show More
Texas District 29
Harris County
Live results
Updated: Nov. 5, 10:35 AM ET
| Candidate | Party | % | Total Votes | |
|---|---|---|---|---|
 | Sylvia Garcia* | Democrat party | 80% | 133,989 |
 | Martha Fierro | Republican party | 20% | 33,619 |
Texas District 30
Dallas County
Live results
Updated: Nov. 5, 10:35 AM ET
| Candidate | Party | % | Total Votes | |
|---|---|---|---|---|
 | Frederick Haynes | Democrat party | 86% | 135,071 |
 | Everett Jackson | Republican party | 14% | 21,166 |
Tarrant County
Live results
Updated: Nov. 5, 10:35 AM ET
| Candidate | Party | % | Total Votes | |
|---|---|---|---|---|
| Frederick Haynes | Democrat party | 74% | 51,800 |
| Everett Jackson | Republican party | 26% | 18,081 |
Texas District 31
Bell County
Live results
Updated: Nov. 5, 10:35 AM ET
| Candidate | Party | % | Total Votes | |
|---|---|---|---|---|
 | John Carter* | Republican party | 50% | 49,508 |
 | Justin Early | Democrat party | 49% | 48,169 |
Show More
Burnet County
Live results
Updated: Nov. 5, 3:04 PM ET
| Candidate | Party | % | Total Votes | |
|---|---|---|---|---|
| John Carter* | Republican party | 74% | 14,534 |
| Justin Early | Democrat party | 25% | 4,889 |
Show More
Coryell County
Live results
Updated: Nov. 5, 10:35 AM ET
| Candidate | Party | % | Total Votes | |
|---|---|---|---|---|
| John Carter* | Republican party | 63% | 11,848 |
| Justin Early | Democrat party | 35% | 6,656 |
Show More
Hamilton County
Live results
Updated: Nov. 5, 10:35 AM ET
| Candidate | Party | % | Total Votes | |
|---|---|---|---|---|
| John Carter* | Republican party | 83% | 2,926 |
| Justin Early | Democrat party | 16% | 571 |
Show More
Lampasas County
Live results
Updated: Nov. 5, 10:35 AM ET
| Candidate | Party | % | Total Votes | |
|---|---|---|---|---|
| John Carter* | Republican party | 75% | 6,849 |
| Justin Early | Democrat party | 23% | 2,111 |
Show More
Mills County
Live results
Updated: Nov. 5, 10:35 AM ET
| Candidate | Party | % | Total Votes | |
|---|---|---|---|---|
| John Carter* | Republican party | 85% | 1,802 |
| Justin Early | Democrat party | 14% | 296 |
Show More
Williamson County
Live results
Updated: Nov. 5, 2:40 PM ET
| Candidate | Party | % | Total Votes | |
|---|---|---|---|---|
| John Carter* | Republican party | 50% | 76,545 |
| Justin Early | Democrat party | 49% | 74,042 |
Show More
Texas District 32
Camp County
Live results
Updated: Nov. 5, 10:35 AM ET
| Candidate | Party | % | Total Votes | |
|---|---|---|---|---|
 | Jace Yarbrough | Republican party | 70% | 2,976 |
 | Dan Barrios | Democrat party | 30% | 1,267 |
Collin County
Live results
Updated: Nov. 5, 3:05 PM ET
| Candidate | Party | % | Total Votes | |
|---|---|---|---|---|
| Dan Barrios | Democrat party | 64% | 9,449 |
| Jace Yarbrough | Republican party | 36% | 5,378 |
Dallas County
Live results
Updated: Nov. 5, 10:35 AM ET
| Candidate | Party | % | Total Votes | |
|---|---|---|---|---|
| Dan Barrios | Democrat party | 62% | 95,544 |
| Jace Yarbrough | Republican party | 38% | 58,031 |
Hunt County
Live results
Updated: Nov. 5, 10:35 AM ET
| Candidate | Party | % | Total Votes | |
|---|---|---|---|---|
| Jace Yarbrough | Republican party | 78% | 8,877 |
| Dan Barrios | Democrat party | 22% | 2,489 |
Rains County
Live results
Updated: Nov. 5, 10:35 AM ET
| Candidate | Party | % | Total Votes | |
|---|---|---|---|---|
| Jace Yarbrough | Republican party | 84% | 4,236 |
| Dan Barrios | Democrat party | 16% | 827 |
Rockwall County
Live results
Updated: Nov. 5, 10:35 AM ET
| Candidate | Party | % | Total Votes | |
|---|---|---|---|---|
| Jace Yarbrough | Republican party | 65% | 34,533 |
| Dan Barrios | Democrat party | 35% | 18,892 |
Upshur County
Live results
Updated: Nov. 5, 10:35 AM ET
| Candidate | Party | % | Total Votes | |
|---|---|---|---|---|
| Jace Yarbrough | Republican party | 81% | 12,518 |
| Dan Barrios | Democrat party | 19% | 2,922 |
Wood County
Live results
Updated: Nov. 5, 10:35 AM ET
| Candidate | Party | % | Total Votes | |
|---|---|---|---|---|
| Jace Yarbrough | Republican party | 83% | 16,285 |
| Dan Barrios | Democrat party | 17% | 3,391 |
Texas District 33
Dallas County
Live results
Updated: Nov. 5, 10:35 AM ET
| Candidate | Party | % | Total Votes | |
|---|---|---|---|---|
 | Colin Allred | Democrat party | 79% | 150,891 |
 | Patrick Gillespie | Republican party | 21% | 41,157 |
Texas District 34
Cameron County
Live results
Updated: Nov. 5, 10:35 AM ET
| Candidate | Party | % | Total Votes | |
|---|---|---|---|---|
 | Vicente Gonzalez* | Democrat party | 62% | 63,156 |
 | Eric Flores | Republican party | 33% | 33,637 |
Show More
Kenedy County
Live results
Updated: Nov. 5, 10:35 AM ET
| Candidate | Party | % | Total Votes | |
|---|---|---|---|---|
| Eric Flores | Republican party | 55% | 84 |
| Vicente Gonzalez* | Democrat party | 41% | 63 |
Show More
Kleberg County
Live results
Updated: Nov. 5, 10:35 AM ET
| Candidate | Party | % | Total Votes | |
|---|---|---|---|---|
| Vicente Gonzalez* | Democrat party | 53% | 4,276 |
| Eric Flores | Republican party | 44% | 3,534 |
Show More
Nueces County
Live results
Updated: Nov. 5, 10:35 AM ET
| Candidate | Party | % | Total Votes | |
|---|---|---|---|---|
| Vicente Gonzalez* | Democrat party | 48% | 42,266 |
| Eric Flores | Republican party | 47% | 41,775 |
Show More
Willacy County
Live results
Updated: Nov. 5, 10:35 AM ET
| Candidate | Party | % | Total Votes | |
|---|---|---|---|---|
| Vicente Gonzalez* | Democrat party | 63% | 2,906 |
| Eric Flores | Republican party | 33% | 1,542 |
Show More
Texas District 35
Bexar County
Live results
Updated: Nov. 5, 10:35 AM ET
| Candidate | Party | % | Total Votes | |
|---|---|---|---|---|
 | Johnny Garcia | Democrat party | 65% | 102,021 |
 | Carlos De La Cruz | Republican party | 35% | 55,062 |
Guadalupe County
Live results
Updated: Nov. 5, 11:29 AM ET
| Candidate | Party | % | Total Votes | |
|---|---|---|---|---|
| Carlos De La Cruz | Republican party | 56% | 39,104 |
| Johnny Garcia | Democrat party | 44% | 30,508 |
Karnes County
Live results
Updated: Nov. 5, 10:35 AM ET
| Candidate | Party | % | Total Votes | |
|---|---|---|---|---|
| Carlos De La Cruz | Republican party | 72% | 2,899 |
| Johnny Garcia | Democrat party | 28% | 1,113 |
Wilson County
Live results
Updated: Nov. 5, 10:35 AM ET
| Candidate | Party | % | Total Votes | |
|---|---|---|---|---|
| Carlos De La Cruz | Republican party | 71% | 15,509 |
| Johnny Garcia | Democrat party | 29% | 6,342 |
Texas District 36
Angelina County
Live results
Updated: Nov. 5, 10:35 AM ET
| Candidate | Party | % | Total Votes | |
|---|---|---|---|---|
 | Brian Babin* | Republican party | 68% | 18,454 |
 | Rhonda Hart | Democrat party | 32% | 8,577 |
Brazoria County
Live results
Updated: Nov. 5, 3:05 PM ET
| Candidate | Party | % | Total Votes | |
|---|---|---|---|---|
| Rhonda Hart | Democrat party | 64% | 22,468 |
| Brian Babin* | Republican party | 36% | 12,624 |
Chambers County
Live results
Updated: Nov. 5, 10:35 AM ET
| Candidate | Party | % | Total Votes | |
|---|---|---|---|---|
| Brian Babin* | Republican party | 76% | 14,727 |
| Rhonda Hart | Democrat party | 24% | 4,593 |
Hardin County
Live results
Updated: Nov. 5, 10:35 AM ET
| Candidate | Party | % | Total Votes | |
|---|---|---|---|---|
| Brian Babin* | Republican party | 84% | 17,616 |
| Rhonda Hart | Democrat party | 16% | 3,333 |
Harris County
Live results
Updated: Nov. 5, 10:35 AM ET
| Candidate | Party | % | Total Votes | |
|---|---|---|---|---|
| Rhonda Hart | Democrat party | 56% | 54,169 |
| Brian Babin* | Republican party | 44% | 42,125 |
Jasper County
Live results
Updated: Nov. 5, 10:35 AM ET
| Candidate | Party | % | Total Votes | |
|---|---|---|---|---|
| Brian Babin* | Republican party | 79% | 9,491 |
| Rhonda Hart | Democrat party | 21% | 2,540 |
Jefferson County
Live results
Updated: Nov. 5, 10:35 AM ET
| Candidate | Party | % | Total Votes | |
|---|---|---|---|---|
| Rhonda Hart | Democrat party | 62% | 22,069 |
| Brian Babin* | Republican party | 38% | 13,418 |
Newton County
Live results
Updated: Nov. 5, 10:35 AM ET
| Candidate | Party | % | Total Votes | |
|---|---|---|---|---|
| Brian Babin* | Republican party | 80% | 3,434 |
| Rhonda Hart | Democrat party | 20% | 833 |
Tyler County
Live results
Updated: Nov. 5, 10:35 AM ET
| Candidate | Party | % | Total Votes | |
|---|---|---|---|---|
| Brian Babin* | Republican party | 85% | 6,119 |
| Rhonda Hart | Democrat party | 15% | 1,099 |
Texas District 37
Travis County
Live results
Updated: Nov. 5, 10:43 AM ET
| Candidate | Party | % | Total Votes | |
|---|---|---|---|---|
 | Greg Casar* | Democrat party | 84% | 254,957 |
 | Lauren Peña | Republican party | 16% | 49,469 |
Texas District 38
Harris County
Live results
Updated: Nov. 5, 10:35 AM ET
| Candidate | Party | % | Total Votes | |
|---|---|---|---|---|
 | Jon Bonck | Republican party | 52% | 157,261 |
 | Melissa McDonough | Democrat party | 47% | 144,397 |
Show More