Live results
Updated: Nov. 5, 4:01 PM ET













Texas Election Results: County
Governor Results
Vote data from the AP
Anderson County
Live results
Updated: Nov. 5, 11:41 AM ET
| Candidate | Party | % | Total Votes | |
|---|---|---|---|---|
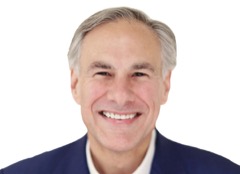 | Greg Abbott* | Republican party | 73% | 11,254 |
 | Gina Hinojosa | Democrat party | 25% | 3,882 |
Andrews County
Live results
Updated: Nov. 5, 11:41 AM ET
| Candidate | Party | % | Total Votes | |
|---|---|---|---|---|
| Greg Abbott* | Republican party | 73% | 3,024 |
| Gina Hinojosa | Democrat party | 25% | 1,060 |
Angelina County
Live results
Updated: Nov. 5, 11:41 AM ET
| Candidate | Party | % | Total Votes | |
|---|---|---|---|---|
| Greg Abbott* | Republican party | 66% | 18,203 |
| Gina Hinojosa | Democrat party | 32% | 8,772 |
Aransas County
Live results
Updated: Nov. 5, 11:41 AM ET
| Candidate | Party | % | Total Votes | |
|---|---|---|---|---|
| Greg Abbott* | Republican party | 73% | 7,778 |
| Gina Hinojosa | Democrat party | 25% | 2,688 |
Archer County
Live results
Updated: Nov. 5, 11:41 AM ET
| Candidate | Party | % | Total Votes | |
|---|---|---|---|---|
| Greg Abbott* | Republican party | 85% | 3,394 |
| Gina Hinojosa | Democrat party | 14% | 542 |
Armstrong County
Live results
Updated: Nov. 5, 11:41 AM ET
| Candidate | Party | % | Total Votes | |
|---|---|---|---|---|
| Greg Abbott* | Republican party | 88% | 767 |
| Gina Hinojosa | Democrat party | 10% | 89 |
Atascosa County
Live results
Updated: Nov. 5, 11:41 AM ET
| Candidate | Party | % | Total Votes | |
|---|---|---|---|---|
| Greg Abbott* | Republican party | 59% | 8,594 |
| Gina Hinojosa | Democrat party | 40% | 5,780 |
Austin County
Live results
Updated: Nov. 5, 11:41 AM ET
| Candidate | Party | % | Total Votes | |
|---|---|---|---|---|
| Greg Abbott* | Republican party | 74% | 9,493 |
| Gina Hinojosa | Democrat party | 25% | 3,177 |
Bailey County
Live results
Updated: Nov. 5, 11:41 AM ET
| Candidate | Party | % | Total Votes | |
|---|---|---|---|---|
| Greg Abbott* | Republican party | 68% | 974 |
| Gina Hinojosa | Democrat party | 30% | 430 |
Bandera County
Live results
Updated: Nov. 5, 11:41 AM ET
| Candidate | Party | % | Total Votes | |
|---|---|---|---|---|
| Greg Abbott* | Republican party | 77% | 7,911 |
| Gina Hinojosa | Democrat party | 21% | 2,155 |
Bastrop County
Live results
Updated: Nov. 5, 11:41 AM ET
| Candidate | Party | % | Total Votes | |
|---|---|---|---|---|
| Gina Hinojosa | Democrat party | 52% | 19,268 |
| Greg Abbott* | Republican party | 47% | 17,253 |
Baylor County
Live results
Updated: Nov. 5, 11:41 AM ET
| Candidate | Party | % | Total Votes | |
|---|---|---|---|---|
| Greg Abbott* | Republican party | 83% | 1,002 |
| Gina Hinojosa | Democrat party | 15% | 176 |
Bee County
Live results
Updated: Nov. 5, 11:41 AM ET
| Candidate | Party | % | Total Votes | |
|---|---|---|---|---|
| Greg Abbott* | Republican party | 58% | 4,157 |
| Gina Hinojosa | Democrat party | 41% | 2,906 |
Bell County
Live results
Updated: Nov. 5, 11:41 AM ET
| Candidate | Party | % | Total Votes | |
|---|---|---|---|---|
| Greg Abbott* | Republican party | 49% | 54,723 |
| Gina Hinojosa | Democrat party | 49% | 54,047 |
Bexar County
Live results
Updated: Nov. 5, 11:41 AM ET
| Candidate | Party | % | Total Votes | |
|---|---|---|---|---|
| Gina Hinojosa | Democrat party | 65% | 427,403 |
| Greg Abbott* | Republican party | 34% | 223,071 |
Blanco County
Live results
Updated: Nov. 5, 11:41 AM ET
| Candidate | Party | % | Total Votes | |
|---|---|---|---|---|
| Greg Abbott* | Republican party | 72% | 5,487 |
| Gina Hinojosa | Democrat party | 27% | 2,016 |
Borden County
Live results
Updated: Nov. 5, 11:41 AM ET
| Candidate | Party | % | Total Votes | |
|---|---|---|---|---|
| Greg Abbott* | Republican party | 93% | 285 |
| Gina Hinojosa | Democrat party | 5% | 15 |
Bosque County
Live results
Updated: Nov. 5, 11:41 AM ET
| Candidate | Party | % | Total Votes | |
|---|---|---|---|---|
| Greg Abbott* | Republican party | 78% | 6,034 |
| Gina Hinojosa | Democrat party | 20% | 1,572 |
Bowie County
Live results
Updated: Nov. 5, 11:42 AM ET
| Candidate | Party | % | Total Votes | |
|---|---|---|---|---|
| Greg Abbott* | Republican party | 67% | 18,575 |
| Gina Hinojosa | Democrat party | 31% | 8,689 |
Brazoria County
Live results
Updated: Nov. 5, 3:05 PM ET
| Candidate | Party | % | Total Votes | |
|---|---|---|---|---|
| Gina Hinojosa | Democrat party | 50% | 70,949 |
| Greg Abbott* | Republican party | 48% | 68,486 |
Brazos County
Live results
Updated: Nov. 5, 11:42 AM ET
| Candidate | Party | % | Total Votes | |
|---|---|---|---|---|
| Gina Hinojosa | Democrat party | 49% | 39,475 |
| Greg Abbott* | Republican party | 49% | 38,883 |
Brewster County
Live results
Updated: Nov. 5, 11:42 AM ET
| Candidate | Party | % | Total Votes | |
|---|---|---|---|---|
| Gina Hinojosa | Democrat party | 53% | 2,017 |
| Greg Abbott* | Republican party | 45% | 1,710 |
Briscoe County
Live results
Updated: Nov. 5, 11:42 AM ET
| Candidate | Party | % | Total Votes | |
|---|---|---|---|---|
| Greg Abbott* | Republican party | 84% | 504 |
| Gina Hinojosa | Democrat party | 15% | 87 |
Brooks County
Live results
Updated: Nov. 5, 11:42 AM ET
| Candidate | Party | % | Total Votes | |
|---|---|---|---|---|
| Gina Hinojosa | Democrat party | 67% | 1,214 |
| Greg Abbott* | Republican party | 32% | 590 |
Brown County
Live results
Updated: Nov. 5, 11:42 AM ET
| Candidate | Party | % | Total Votes | |
|---|---|---|---|---|
| Greg Abbott* | Republican party | 81% | 10,498 |
| Gina Hinojosa | Democrat party | 17% | 2,260 |
Burleson County
Live results
Updated: Nov. 5, 11:42 AM ET
| Candidate | Party | % | Total Votes | |
|---|---|---|---|---|
| Greg Abbott* | Republican party | 76% | 5,904 |
| Gina Hinojosa | Democrat party | 23% | 1,779 |
Burnet County
Live results
Updated: Nov. 5, 3:04 PM ET
| Candidate | Party | % | Total Votes | |
|---|---|---|---|---|
| Greg Abbott* | Republican party | 71% | 17,329 |
| Gina Hinojosa | Democrat party | 27% | 6,692 |
Caldwell County
Live results
Updated: Nov. 5, 11:42 AM ET
| Candidate | Party | % | Total Votes | |
|---|---|---|---|---|
| Gina Hinojosa | Democrat party | 55% | 8,147 |
| Greg Abbott* | Republican party | 44% | 6,457 |
Calhoun County
Live results
Updated: Nov. 5, 11:42 AM ET
| Candidate | Party | % | Total Votes | |
|---|---|---|---|---|
| Greg Abbott* | Republican party | 66% | 4,223 |
| Gina Hinojosa | Democrat party | 32% | 2,039 |
Callahan County
Live results
Updated: Nov. 5, 11:42 AM ET
| Candidate | Party | % | Total Votes | |
|---|---|---|---|---|
| Greg Abbott* | Republican party | 82% | 4,445 |
| Gina Hinojosa | Democrat party | 15% | 820 |
Cameron County
Live results
Updated: Nov. 5, 11:42 AM ET
| Candidate | Party | % | Total Votes | |
|---|---|---|---|---|
| Gina Hinojosa | Democrat party | 67% | 68,613 |
| Greg Abbott* | Republican party | 32% | 33,101 |
Camp County
Live results
Updated: Nov. 5, 11:42 AM ET
| Candidate | Party | % | Total Votes | |
|---|---|---|---|---|
| Greg Abbott* | Republican party | 68% | 2,916 |
| Gina Hinojosa | Democrat party | 31% | 1,314 |
Carson County
Live results
Updated: Nov. 5, 11:42 AM ET
| Candidate | Party | % | Total Votes | |
|---|---|---|---|---|
| Greg Abbott* | Republican party | 84% | 2,006 |
| Gina Hinojosa | Democrat party | 14% | 330 |
Cass County
Live results
Updated: Nov. 5, 11:42 AM ET
| Candidate | Party | % | Total Votes | |
|---|---|---|---|---|
| Greg Abbott* | Republican party | 78% | 8,529 |
| Gina Hinojosa | Democrat party | 20% | 2,191 |
Castro County
Live results
Updated: Nov. 5, 11:42 AM ET
| Candidate | Party | % | Total Votes | |
|---|---|---|---|---|
| Greg Abbott* | Republican party | 71% | 1,098 |
| Gina Hinojosa | Democrat party | 28% | 432 |
Chambers County
Live results
Updated: Nov. 5, 11:42 AM ET
| Candidate | Party | % | Total Votes | |
|---|---|---|---|---|
| Greg Abbott* | Republican party | 73% | 14,282 |
| Gina Hinojosa | Democrat party | 25% | 4,871 |
Cherokee County
Live results
Updated: Nov. 5, 11:42 AM ET
| Candidate | Party | % | Total Votes | |
|---|---|---|---|---|
| Greg Abbott* | Republican party | 73% | 12,117 |
| Gina Hinojosa | Democrat party | 26% | 4,241 |
Childress County
Live results
Updated: Nov. 5, 11:42 AM ET
| Candidate | Party | % | Total Votes | |
|---|---|---|---|---|
| Greg Abbott* | Republican party | 79% | 1,340 |
| Gina Hinojosa | Democrat party | 18% | 301 |
Clay County
Live results
Updated: Nov. 5, 11:42 AM ET
| Candidate | Party | % | Total Votes | |
|---|---|---|---|---|
| Greg Abbott* | Republican party | 84% | 3,911 |
| Gina Hinojosa | Democrat party | 14% | 650 |
Cochran County
Live results
Updated: Nov. 5, 11:42 AM ET
| Candidate | Party | % | Total Votes | |
|---|---|---|---|---|
| Greg Abbott* | Republican party | 69% | 482 |
| Gina Hinojosa | Democrat party | 28% | 199 |
Coke County
Live results
Updated: Nov. 5, 11:42 AM ET
| Candidate | Party | % | Total Votes | |
|---|---|---|---|---|
| Greg Abbott* | Republican party | 84% | 1,135 |
| Gina Hinojosa | Democrat party | 14% | 192 |
Coleman County
Live results
Updated: Nov. 5, 11:42 AM ET
| Candidate | Party | % | Total Votes | |
|---|---|---|---|---|
| Greg Abbott* | Republican party | 85% | 2,774 |
| Gina Hinojosa | Democrat party | 13% | 428 |
Collin County
Live results
Updated: Nov. 5, 3:05 PM ET
| Candidate | Party | % | Total Votes | |
|---|---|---|---|---|
| Gina Hinojosa | Democrat party | 51% | 236,034 |
| Greg Abbott* | Republican party | 47% | 215,566 |
Collingsworth County
Live results
Updated: Nov. 5, 11:42 AM ET
| Candidate | Party | % | Total Votes | |
|---|---|---|---|---|
| Greg Abbott* | Republican party | 84% | 807 |
| Gina Hinojosa | Democrat party | 15% | 142 |
Colorado County
Live results
Updated: Nov. 5, 11:42 AM ET
| Candidate | Party | % | Total Votes | |
|---|---|---|---|---|
| Greg Abbott* | Republican party | 73% | 6,090 |
| Gina Hinojosa | Democrat party | 26% | 2,199 |
Comal County
Live results
Updated: Nov. 5, 11:42 AM ET
| Candidate | Party | % | Total Votes | |
|---|---|---|---|---|
| Greg Abbott* | Republican party | 66% | 58,818 |
| Gina Hinojosa | Democrat party | 32% | 28,967 |
Comanche County
Live results
Updated: Nov. 5, 11:43 AM ET
| Candidate | Party | % | Total Votes | |
|---|---|---|---|---|
| Greg Abbott* | Republican party | 79% | 4,067 |
| Gina Hinojosa | Democrat party | 19% | 987 |
Concho County
Live results
Updated: Nov. 5, 11:43 AM ET
| Candidate | Party | % | Total Votes | |
|---|---|---|---|---|
| Greg Abbott* | Republican party | 80% | 798 |
| Gina Hinojosa | Democrat party | 18% | 182 |
Cooke County
Live results
Updated: Nov. 5, 11:43 AM ET
| Candidate | Party | % | Total Votes | |
|---|---|---|---|---|
| Greg Abbott* | Republican party | 76% | 13,167 |
| Gina Hinojosa | Democrat party | 22% | 3,805 |
Coryell County
Live results
Updated: Nov. 5, 11:43 AM ET
| Candidate | Party | % | Total Votes | |
|---|---|---|---|---|
| Greg Abbott* | Republican party | 61% | 11,562 |
| Gina Hinojosa | Democrat party | 36% | 6,861 |
Cottle County
Live results
Updated: Nov. 5, 11:43 AM ET
| Candidate | Party | % | Total Votes | |
|---|---|---|---|---|
| Greg Abbott* | Republican party | 80% | 436 |
| Gina Hinojosa | Democrat party | 18% | 97 |
Crane County
Live results
Updated: Nov. 5, 11:43 AM ET
| Candidate | Party | % | Total Votes | |
|---|---|---|---|---|
| Greg Abbott* | Republican party | 72% | 733 |
| Gina Hinojosa | Democrat party | 27% | 270 |
Crockett County
Live results
Updated: Nov. 5, 11:43 AM ET
| Candidate | Party | % | Total Votes | |
|---|---|---|---|---|
| Greg Abbott* | Republican party | 66% | 660 |
| Gina Hinojosa | Democrat party | 32% | 321 |
Crosby County
Live results
Updated: Nov. 5, 11:43 AM ET
| Candidate | Party | % | Total Votes | |
|---|---|---|---|---|
| Greg Abbott* | Republican party | 65% | 975 |
| Gina Hinojosa | Democrat party | 33% | 494 |
Culberson County
Live results
Updated: Nov. 5, 11:43 AM ET
| Candidate | Party | % | Total Votes | |
|---|---|---|---|---|
| Gina Hinojosa | Democrat party | 57% | 506 |
| Greg Abbott* | Republican party | 41% | 363 |
Dallam County
Live results
Updated: Nov. 5, 11:43 AM ET
| Candidate | Party | % | Total Votes | |
|---|---|---|---|---|
| Greg Abbott* | Republican party | 76% | 774 |
| Gina Hinojosa | Democrat party | 23% | 233 |
Dallas County
Live results
Updated: Nov. 5, 11:43 AM ET
| Candidate | Party | % | Total Votes | |
|---|---|---|---|---|
| Gina Hinojosa | Democrat party | 69% | 539,682 |
| Greg Abbott* | Republican party | 30% | 231,770 |
Dawson County
Live results
Updated: Nov. 5, 11:43 AM ET
| Candidate | Party | % | Total Votes | |
|---|---|---|---|---|
| Greg Abbott* | Republican party | 72% | 1,849 |
| Gina Hinojosa | Democrat party | 27% | 688 |
Deaf Smith County
Live results
Updated: Nov. 5, 11:43 AM ET
| Candidate | Party | % | Total Votes | |
|---|---|---|---|---|
| Greg Abbott* | Republican party | 59% | 2,086 |
| Gina Hinojosa | Democrat party | 40% | 1,407 |
Delta County
Live results
Updated: Nov. 5, 11:43 AM ET
| Candidate | Party | % | Total Votes | |
|---|---|---|---|---|
| Greg Abbott* | Republican party | 78% | 1,572 |
| Gina Hinojosa | Democrat party | 20% | 401 |
Denton County
Live results
Updated: Nov. 5, 11:43 AM ET
| Candidate | Party | % | Total Votes | |
|---|---|---|---|---|
| Gina Hinojosa | Democrat party | 50% | 199,625 |
| Greg Abbott* | Republican party | 48% | 191,413 |
DeWitt County
Live results
Updated: Nov. 5, 3:05 PM ET
| Candidate | Party | % | Total Votes | |
|---|---|---|---|---|
| Greg Abbott* | Republican party | 78% | 4,881 |
| Gina Hinojosa | Democrat party | 21% | 1,309 |
Dickens County
Live results
Updated: Nov. 5, 11:43 AM ET
| Candidate | Party | % | Total Votes | |
|---|---|---|---|---|
| Greg Abbott* | Republican party | 81% | 607 |
| Gina Hinojosa | Democrat party | 18% | 137 |
Dimmit County
Live results
Updated: Nov. 5, 11:43 AM ET
| Candidate | Party | % | Total Votes | |
|---|---|---|---|---|
| Gina Hinojosa | Democrat party | 67% | 1,823 |
| Greg Abbott* | Republican party | 32% | 863 |
Donley County
Live results
Updated: Nov. 5, 11:43 AM ET
| Candidate | Party | % | Total Votes | |
|---|---|---|---|---|
| Greg Abbott* | Republican party | 85% | 1,082 |
| Gina Hinojosa | Democrat party | 14% | 178 |
Duval County
Live results
Updated: Nov. 5, 11:43 AM ET
| Candidate | Party | % | Total Votes | |
|---|---|---|---|---|
| Gina Hinojosa | Democrat party | 63% | 2,117 |
| Greg Abbott* | Republican party | 35% | 1,174 |
Eastland County
Live results
Updated: Nov. 5, 11:43 AM ET
| Candidate | Party | % | Total Votes | |
|---|---|---|---|---|
| Greg Abbott* | Republican party | 81% | 5,170 |
| Gina Hinojosa | Democrat party | 16% | 1,046 |
Ector County
Live results
Updated: Nov. 5, 11:43 AM ET
| Candidate | Party | % | Total Votes | |
|---|---|---|---|---|
| Greg Abbott* | Republican party | 61% | 17,905 |
| Gina Hinojosa | Democrat party | 38% | 11,160 |
Edwards County
Live results
Updated: Nov. 5, 11:43 AM ET
| Candidate | Party | % | Total Votes | |
|---|---|---|---|---|
| Greg Abbott* | Republican party | 80% | 650 |
| Gina Hinojosa | Democrat party | 19% | 152 |
Ellis County
Live results
Updated: Nov. 5, 11:43 AM ET
| Candidate | Party | % | Total Votes | |
|---|---|---|---|---|
| Greg Abbott* | Republican party | 53% | 47,284 |
| Gina Hinojosa | Democrat party | 45% | 39,908 |
El Paso County
Live results
Updated: Nov. 5, 11:43 AM ET
| Candidate | Party | % | Total Votes | |
|---|---|---|---|---|
| Gina Hinojosa | Democrat party | 70% | 153,639 |
| Greg Abbott* | Republican party | 28% | 61,410 |
Erath County
Live results
Updated: Nov. 5, 11:43 AM ET
| Candidate | Party | % | Total Votes | |
|---|---|---|---|---|
| Greg Abbott* | Republican party | 74% | 10,434 |
| Gina Hinojosa | Democrat party | 24% | 3,446 |
Falls County
Live results
Updated: Nov. 5, 11:43 AM ET
| Candidate | Party | % | Total Votes | |
|---|---|---|---|---|
| Greg Abbott* | Republican party | 66% | 3,241 |
| Gina Hinojosa | Democrat party | 33% | 1,624 |
Fannin County
Live results
Updated: Nov. 5, 11:43 AM ET
| Candidate | Party | % | Total Votes | |
|---|---|---|---|---|
| Greg Abbott* | Republican party | 77% | 9,952 |
| Gina Hinojosa | Democrat party | 21% | 2,788 |
Fayette County
Live results
Updated: Nov. 5, 11:43 AM ET
| Candidate | Party | % | Total Votes | |
|---|---|---|---|---|
| Greg Abbott* | Republican party | 74% | 8,381 |
| Gina Hinojosa | Democrat party | 24% | 2,743 |
Fisher County
Live results
Updated: Nov. 5, 11:43 AM ET
| Candidate | Party | % | Total Votes | |
|---|---|---|---|---|
| Greg Abbott* | Republican party | 76% | 1,077 |
| Gina Hinojosa | Democrat party | 21% | 305 |
Floyd County
Live results
Updated: Nov. 5, 11:43 AM ET
| Candidate | Party | % | Total Votes | |
|---|---|---|---|---|
| Greg Abbott* | Republican party | 72% | 1,172 |
| Gina Hinojosa | Democrat party | 27% | 445 |
Foard County
Live results
Updated: Nov. 5, 11:44 AM ET
| Candidate | Party | % | Total Votes | |
|---|---|---|---|---|
| Greg Abbott* | Republican party | 77% | 318 |
| Gina Hinojosa | Democrat party | 21% | 85 |
Fort Bend County
Live results
Updated: Nov. 5, 11:44 AM ET
| Candidate | Party | % | Total Votes | |
|---|---|---|---|---|
| Gina Hinojosa | Democrat party | 61% | 201,012 |
| Greg Abbott* | Republican party | 38% | 126,059 |
Franklin County
Live results
Updated: Nov. 5, 11:44 AM ET
| Candidate | Party | % | Total Votes | |
|---|---|---|---|---|
| Greg Abbott* | Republican party | 79% | 3,381 |
| Gina Hinojosa | Democrat party | 20% | 835 |
Freestone County
Live results
Updated: Nov. 5, 11:44 AM ET
| Candidate | Party | % | Total Votes | |
|---|---|---|---|---|
| Greg Abbott* | Republican party | 75% | 5,532 |
| Gina Hinojosa | Democrat party | 23% | 1,690 |
Frio County
Live results
Updated: Nov. 5, 11:44 AM ET
| Candidate | Party | % | Total Votes | |
|---|---|---|---|---|
| Gina Hinojosa | Democrat party | 52% | 1,981 |
| Greg Abbott* | Republican party | 47% | 1,792 |
Gaines County
Live results
Updated: Nov. 5, 11:44 AM ET
| Candidate | Party | % | Total Votes | |
|---|---|---|---|---|
| Greg Abbott* | Republican party | 82% | 3,925 |
| Gina Hinojosa | Democrat party | 16% | 788 |
Galveston County
Live results
Updated: Nov. 5, 11:44 AM ET
| Candidate | Party | % | Total Votes | |
|---|---|---|---|---|
| Greg Abbott* | Republican party | 54% | 72,745 |
| Gina Hinojosa | Democrat party | 44% | 59,716 |
Garza County
Live results
Updated: Nov. 5, 11:44 AM ET
| Candidate | Party | % | Total Votes | |
|---|---|---|---|---|
| Greg Abbott* | Republican party | 77% | 896 |
| Gina Hinojosa | Democrat party | 20% | 233 |
Gillespie County
Live results
Updated: Nov. 5, 11:44 AM ET
| Candidate | Party | % | Total Votes | |
|---|---|---|---|---|
| Greg Abbott* | Republican party | 75% | 11,021 |
| Gina Hinojosa | Democrat party | 23% | 3,413 |
Glasscock County
Live results
Updated: Nov. 5, 11:44 AM ET
| Candidate | Party | % | Total Votes | |
|---|---|---|---|---|
| Greg Abbott* | Republican party | 90% | 503 |
| Gina Hinojosa | Democrat party | 9% | 51 |
Goliad County
Live results
Updated: Nov. 5, 11:44 AM ET
| Candidate | Party | % | Total Votes | |
|---|---|---|---|---|
| Greg Abbott* | Republican party | 74% | 2,500 |
| Gina Hinojosa | Democrat party | 25% | 842 |
Gonzales County
Live results
Updated: Nov. 5, 11:44 AM ET
| Candidate | Party | % | Total Votes | |
|---|---|---|---|---|
| Greg Abbott* | Republican party | 66% | 4,447 |
| Gina Hinojosa | Democrat party | 32% | 2,147 |
Gray County
Live results
Updated: Nov. 5, 11:44 AM ET
| Candidate | Party | % | Total Votes | |
|---|---|---|---|---|
| Greg Abbott* | Republican party | 80% | 4,410 |
| Gina Hinojosa | Democrat party | 18% | 979 |
Grayson County
Live results
Updated: Nov. 5, 11:44 AM ET
| Candidate | Party | % | Total Votes | |
|---|---|---|---|---|
| Greg Abbott* | Republican party | 70% | 37,644 |
| Gina Hinojosa | Democrat party | 28% | 15,327 |
Gregg County
Live results
Updated: Nov. 5, 11:44 AM ET
| Candidate | Party | % | Total Votes | |
|---|---|---|---|---|
| Greg Abbott* | Republican party | 61% | 23,347 |
| Gina Hinojosa | Democrat party | 37% | 14,179 |
Grimes County
Live results
Updated: Nov. 5, 11:44 AM ET
| Candidate | Party | % | Total Votes | |
|---|---|---|---|---|
| Greg Abbott* | Republican party | 72% | 8,484 |
| Gina Hinojosa | Democrat party | 26% | 3,001 |
Guadalupe County
Live results
Updated: Nov. 5, 11:44 AM ET
| Candidate | Party | % | Total Votes | |
|---|---|---|---|---|
| Greg Abbott* | Republican party | 54% | 38,597 |
| Gina Hinojosa | Democrat party | 44% | 31,478 |
Hale County
Live results
Updated: Nov. 5, 11:44 AM ET
| Candidate | Party | % | Total Votes | |
|---|---|---|---|---|
| Greg Abbott* | Republican party | 66% | 4,967 |
| Gina Hinojosa | Democrat party | 32% | 2,452 |
Hall County
Live results
Updated: Nov. 5, 11:44 AM ET
| Candidate | Party | % | Total Votes | |
|---|---|---|---|---|
| Greg Abbott* | Republican party | 79% | 656 |
| Gina Hinojosa | Democrat party | 18% | 152 |
Hamilton County
Live results
Updated: Nov. 5, 11:44 AM ET
| Candidate | Party | % | Total Votes | |
|---|---|---|---|---|
| Greg Abbott* | Republican party | 81% | 2,889 |
| Gina Hinojosa | Democrat party | 17% | 623 |
Hansford County
Live results
Updated: Nov. 5, 11:44 AM ET
| Candidate | Party | % | Total Votes | |
|---|---|---|---|---|
| Greg Abbott* | Republican party | 81% | 1,229 |
| Gina Hinojosa | Democrat party | 17% | 253 |
Hardeman County
Live results
Updated: Nov. 5, 11:44 AM ET
| Candidate | Party | % | Total Votes | |
|---|---|---|---|---|
| Greg Abbott* | Republican party | 80% | 777 |
| Gina Hinojosa | Democrat party | 19% | 181 |
Hardin County
Live results
Updated: Nov. 5, 11:44 AM ET
| Candidate | Party | % | Total Votes | |
|---|---|---|---|---|
| Greg Abbott* | Republican party | 81% | 17,088 |
| Gina Hinojosa | Democrat party | 17% | 3,607 |
Harris County
Live results
Updated: Nov. 5, 11:44 AM ET
| Candidate | Party | % | Total Votes | |
|---|---|---|---|---|
| Gina Hinojosa | Democrat party | 64% | 879,134 |
| Greg Abbott* | Republican party | 35% | 483,850 |
Harrison County
Live results
Updated: Nov. 5, 11:44 AM ET
| Candidate | Party | % | Total Votes | |
|---|---|---|---|---|
| Greg Abbott* | Republican party | 68% | 16,405 |
| Gina Hinojosa | Democrat party | 30% | 7,308 |
Hartley County
Live results
Updated: Nov. 5, 11:44 AM ET
| Candidate | Party | % | Total Votes | |
|---|---|---|---|---|
| Greg Abbott* | Republican party | 84% | 1,302 |
| Gina Hinojosa | Democrat party | 14% | 216 |
Haskell County
Live results
Updated: Nov. 5, 11:44 AM ET
| Candidate | Party | % | Total Votes | |
|---|---|---|---|---|
| Greg Abbott* | Republican party | 79% | 1,287 |
| Gina Hinojosa | Democrat party | 19% | 301 |
Hays County
Live results
Updated: Nov. 5, 3:06 PM ET
| Candidate | Party | % | Total Votes | |
|---|---|---|---|---|
| Gina Hinojosa | Democrat party | 63% | 75,219 |
| Greg Abbott* | Republican party | 36% | 42,903 |
Hemphill County
Live results
Updated: Nov. 5, 11:44 AM ET
| Candidate | Party | % | Total Votes | |
|---|---|---|---|---|
| Greg Abbott* | Republican party | 77% | 959 |
| Gina Hinojosa | Democrat party | 20% | 251 |
Henderson County
Live results
Updated: Nov. 5, 11:44 AM ET
| Candidate | Party | % | Total Votes | |
|---|---|---|---|---|
| Greg Abbott* | Republican party | 74% | 23,212 |
| Gina Hinojosa | Democrat party | 24% | 7,536 |
Hidalgo County
Live results
Updated: Nov. 5, 11:45 AM ET
| Candidate | Party | % | Total Votes | |
|---|---|---|---|---|
| Gina Hinojosa | Democrat party | 71% | 143,417 |
| Greg Abbott* | Republican party | 28% | 57,948 |
Hill County
Live results
Updated: Nov. 5, 11:45 AM ET
| Candidate | Party | % | Total Votes | |
|---|---|---|---|---|
| Greg Abbott* | Republican party | 74% | 9,741 |
| Gina Hinojosa | Democrat party | 24% | 3,222 |
Hockley County
Live results
Updated: Nov. 5, 11:45 AM ET
| Candidate | Party | % | Total Votes | |
|---|---|---|---|---|
| Greg Abbott* | Republican party | 73% | 4,698 |
| Gina Hinojosa | Democrat party | 26% | 1,656 |
Hood County
Live results
Updated: Nov. 5, 3:03 PM ET
| Candidate | Party | % | Total Votes | |
|---|---|---|---|---|
| Greg Abbott* | Republican party | 77% | 23,380 |
| Gina Hinojosa | Democrat party | 21% | 6,515 |
Hopkins County
Live results
Updated: Nov. 5, 11:45 AM ET
| Candidate | Party | % | Total Votes | |
|---|---|---|---|---|
| Greg Abbott* | Republican party | 74% | 9,825 |
| Gina Hinojosa | Democrat party | 25% | 3,277 |
Houston County
Live results
Updated: Nov. 5, 11:45 AM ET
| Candidate | Party | % | Total Votes | |
|---|---|---|---|---|
| Greg Abbott* | Republican party | 74% | 5,525 |
| Gina Hinojosa | Democrat party | 25% | 1,866 |
Howard County
Live results
Updated: Nov. 5, 11:45 AM ET
| Candidate | Party | % | Total Votes | |
|---|---|---|---|---|
| Greg Abbott* | Republican party | 71% | 5,046 |
| Gina Hinojosa | Democrat party | 27% | 1,900 |
Hudspeth County
Live results
Updated: Nov. 5, 11:45 AM ET
| Candidate | Party | % | Total Votes | |
|---|---|---|---|---|
| Greg Abbott* | Republican party | 59% | 479 |
| Gina Hinojosa | Democrat party | 38% | 312 |
Hunt County
Live results
Updated: Nov. 5, 11:45 AM ET
| Candidate | Party | % | Total Votes | |
|---|---|---|---|---|
| Greg Abbott* | Republican party | 68% | 25,526 |
| Gina Hinojosa | Democrat party | 30% | 11,390 |
Hutchinson County
Live results
Updated: Nov. 5, 11:45 AM ET
| Candidate | Party | % | Total Votes | |
|---|---|---|---|---|
| Greg Abbott* | Republican party | 81% | 4,937 |
| Gina Hinojosa | Democrat party | 17% | 1,035 |
Irion County
Live results
Updated: Nov. 5, 11:45 AM ET
| Candidate | Party | % | Total Votes | |
|---|---|---|---|---|
| Greg Abbott* | Republican party | 84% | 539 |
| Gina Hinojosa | Democrat party | 14% | 93 |
Jack County
Live results
Updated: Nov. 5, 11:45 AM ET
| Candidate | Party | % | Total Votes | |
|---|---|---|---|---|
| Greg Abbott* | Republican party | 83% | 2,852 |
| Gina Hinojosa | Democrat party | 14% | 495 |
Jackson County
Live results
Updated: Nov. 5, 11:45 AM ET
| Candidate | Party | % | Total Votes | |
|---|---|---|---|---|
| Greg Abbott* | Republican party | 78% | 3,934 |
| Gina Hinojosa | Democrat party | 21% | 1,042 |
Jasper County
Live results
Updated: Nov. 5, 11:45 AM ET
| Candidate | Party | % | Total Votes | |
|---|---|---|---|---|
| Greg Abbott* | Republican party | 77% | 9,367 |
| Gina Hinojosa | Democrat party | 21% | 2,589 |
Jeff Davis County
Live results
Updated: Nov. 5, 11:45 AM ET
| Candidate | Party | % | Total Votes | |
|---|---|---|---|---|
| Greg Abbott* | Republican party | 54% | 549 |
| Gina Hinojosa | Democrat party | 43% | 444 |
Jefferson County
Live results
Updated: Nov. 5, 11:45 AM ET
| Candidate | Party | % | Total Votes | |
|---|---|---|---|---|
| Gina Hinojosa | Democrat party | 54% | 39,380 |
| Greg Abbott* | Republican party | 45% | 32,737 |
Jim Hogg County
Live results
Updated: Nov. 5, 11:45 AM ET
| Candidate | Party | % | Total Votes | |
|---|---|---|---|---|
| Gina Hinojosa | Democrat party | 72% | 987 |
| Greg Abbott* | Republican party | 27% | 372 |
Jim Wells County
Live results
Updated: Nov. 5, 11:45 AM ET
| Candidate | Party | % | Total Votes | |
|---|---|---|---|---|
| Gina Hinojosa | Democrat party | 54% | 5,818 |
| Greg Abbott* | Republican party | 44% | 4,750 |
Johnson County
Live results
Updated: Nov. 5, 11:45 AM ET
| Candidate | Party | % | Total Votes | |
|---|---|---|---|---|
| Greg Abbott* | Republican party | 64% | 45,154 |
| Gina Hinojosa | Democrat party | 34% | 23,673 |
Jones County
Live results
Updated: Nov. 5, 11:45 AM ET
| Candidate | Party | % | Total Votes | |
|---|---|---|---|---|
| Greg Abbott* | Republican party | 78% | 4,113 |
| Gina Hinojosa | Democrat party | 19% | 1,015 |
Karnes County
Live results
Updated: Nov. 5, 11:45 AM ET
| Candidate | Party | % | Total Votes | |
|---|---|---|---|---|
| Greg Abbott* | Republican party | 70% | 2,851 |
| Gina Hinojosa | Democrat party | 29% | 1,155 |
Kaufman County
Live results
Updated: Nov. 5, 11:45 AM ET
| Candidate | Party | % | Total Votes | |
|---|---|---|---|---|
| Greg Abbott* | Republican party | 50% | 31,451 |
| Gina Hinojosa | Democrat party | 48% | 29,874 |
Kendall County
Live results
Updated: Nov. 5, 11:45 AM ET
| Candidate | Party | % | Total Votes | |
|---|---|---|---|---|
| Greg Abbott* | Republican party | 73% | 19,152 |
| Gina Hinojosa | Democrat party | 25% | 6,654 |
Kenedy County
Live results
Updated: Nov. 5, 11:45 AM ET
| Candidate | Party | % | Total Votes | |
|---|---|---|---|---|
| Greg Abbott* | Republican party | 58% | 93 |
| Gina Hinojosa | Democrat party | 41% | 65 |
Kent County
Live results
Updated: Nov. 5, 11:45 AM ET
| Candidate | Party | % | Total Votes | |
|---|---|---|---|---|
| Greg Abbott* | Republican party | 81% | 304 |
| Gina Hinojosa | Democrat party | 18% | 69 |
Kerr County
Live results
Updated: Nov. 5, 3:04 PM ET
| Candidate | Party | % | Total Votes | |
|---|---|---|---|---|
| Greg Abbott* | Republican party | 71% | 16,638 |
| Gina Hinojosa | Democrat party | 28% | 6,479 |
Kimble County
Live results
Updated: Nov. 5, 11:45 AM ET
| Candidate | Party | % | Total Votes | |
|---|---|---|---|---|
| Greg Abbott* | Republican party | 83% | 1,639 |
| Gina Hinojosa | Democrat party | 15% | 300 |
King County
Live results
Updated: Nov. 5, 11:45 AM ET
| Candidate | Party | % | Total Votes | |
|---|---|---|---|---|
| Greg Abbott* | Republican party | 92% | 109 |
| Gina Hinojosa | Democrat party | 6% | 7 |
Kinney County
Live results
Updated: Nov. 5, 11:45 AM ET
| Candidate | Party | % | Total Votes | |
|---|---|---|---|---|
| Greg Abbott* | Republican party | 65% | 817 |
| Gina Hinojosa | Democrat party | 33% | 411 |
Kleberg County
Live results
Updated: Nov. 5, 11:45 AM ET
| Candidate | Party | % | Total Votes | |
|---|---|---|---|---|
| Gina Hinojosa | Democrat party | 54% | 4,458 |
| Greg Abbott* | Republican party | 45% | 3,661 |
Knox County
Live results
Updated: Nov. 5, 11:45 AM ET
| Candidate | Party | % | Total Votes | |
|---|---|---|---|---|
| Greg Abbott* | Republican party | 75% | 754 |
| Gina Hinojosa | Democrat party | 23% | 236 |
Lamar County
Live results
Updated: Nov. 5, 11:46 AM ET
| Candidate | Party | % | Total Votes | |
|---|---|---|---|---|
| Greg Abbott* | Republican party | 73% | 11,954 |
| Gina Hinojosa | Democrat party | 26% | 4,234 |
Lamb County
Live results
Updated: Nov. 5, 11:49 AM ET
| Candidate | Party | % | Total Votes | |
|---|---|---|---|---|
| Greg Abbott* | Republican party | 73% | 2,399 |
| Gina Hinojosa | Democrat party | 25% | 839 |
Lampasas County
Live results
Updated: Nov. 5, 11:46 AM ET
| Candidate | Party | % | Total Votes | |
|---|---|---|---|---|
| Greg Abbott* | Republican party | 74% | 6,806 |
| Gina Hinojosa | Democrat party | 24% | 2,244 |
La Salle County
Live results
Updated: Nov. 5, 11:46 AM ET
| Candidate | Party | % | Total Votes | |
|---|---|---|---|---|
| Gina Hinojosa | Democrat party | 52% | 998 |
| Greg Abbott* | Republican party | 46% | 886 |
Lavaca County
Live results
Updated: Nov. 5, 11:46 AM ET
| Candidate | Party | % | Total Votes | |
|---|---|---|---|---|
| Greg Abbott* | Republican party | 83% | 7,182 |
| Gina Hinojosa | Democrat party | 15% | 1,328 |
Lee County
Live results
Updated: Nov. 5, 11:46 AM ET
| Candidate | Party | % | Total Votes | |
|---|---|---|---|---|
| Greg Abbott* | Republican party | 73% | 5,053 |
| Gina Hinojosa | Democrat party | 26% | 1,819 |
Leon County
Live results
Updated: Nov. 5, 11:46 AM ET
| Candidate | Party | % | Total Votes | |
|---|---|---|---|---|
| Greg Abbott* | Republican party | 83% | 5,894 |
| Gina Hinojosa | Democrat party | 15% | 1,079 |
Liberty County
Live results
Updated: Nov. 5, 11:46 AM ET
| Candidate | Party | % | Total Votes | |
|---|---|---|---|---|
| Greg Abbott* | Republican party | 65% | 16,459 |
| Gina Hinojosa | Democrat party | 34% | 8,694 |
Limestone County
Live results
Updated: Nov. 5, 11:46 AM ET
| Candidate | Party | % | Total Votes | |
|---|---|---|---|---|
| Greg Abbott* | Republican party | 69% | 5,057 |
| Gina Hinojosa | Democrat party | 29% | 2,110 |
Lipscomb County
Live results
Updated: Nov. 5, 11:46 AM ET
| Candidate | Party | % | Total Votes | |
|---|---|---|---|---|
| Greg Abbott* | Republican party | 84% | 784 |
| Gina Hinojosa | Democrat party | 13% | 126 |
Live Oak County
Live results
Updated: Nov. 5, 11:46 AM ET
| Candidate | Party | % | Total Votes | |
|---|---|---|---|---|
| Greg Abbott* | Republican party | 80% | 3,083 |
| Gina Hinojosa | Democrat party | 19% | 732 |
Llano County
Live results
Updated: Nov. 5, 11:46 AM ET
| Candidate | Party | % | Total Votes | |
|---|---|---|---|---|
| Greg Abbott* | Republican party | 77% | 9,025 |
| Gina Hinojosa | Democrat party | 21% | 2,514 |
Loving County
Live results
Updated: Nov. 5, 11:46 AM ET
| Candidate | Party | % | Total Votes | |
|---|---|---|---|---|
| Greg Abbott* | Republican party | 82% | 56 |
| Gina Hinojosa | Democrat party | 13% | 9 |
Lubbock County
Live results
Updated: Nov. 5, 3:05 PM ET
| Candidate | Party | % | Total Votes | |
|---|---|---|---|---|
| Greg Abbott* | Republican party | 59% | 61,949 |
| Gina Hinojosa | Democrat party | 39% | 40,574 |
Lynn County
Live results
Updated: Nov. 5, 11:46 AM ET
| Candidate | Party | % | Total Votes | |
|---|---|---|---|---|
| Greg Abbott* | Republican party | 78% | 1,648 |
| Gina Hinojosa | Democrat party | 21% | 442 |
McCulloch County
Live results
Updated: Nov. 5, 11:46 AM ET
| Candidate | Party | % | Total Votes | |
|---|---|---|---|---|
| Greg Abbott* | Republican party | 80% | 2,142 |
| Gina Hinojosa | Democrat party | 18% | 481 |
McLennan County
Live results
Updated: Nov. 5, 11:46 AM ET
| Candidate | Party | % | Total Votes | |
|---|---|---|---|---|
| Greg Abbott* | Republican party | 56% | 46,939 |
| Gina Hinojosa | Democrat party | 42% | 35,156 |
McMullen County
Live results
Updated: Nov. 5, 11:46 AM ET
| Candidate | Party | % | Total Votes | |
|---|---|---|---|---|
| Greg Abbott* | Republican party | 85% | 324 |
| Gina Hinojosa | Democrat party | 14% | 54 |
Madison County
Live results
Updated: Nov. 5, 11:46 AM ET
| Candidate | Party | % | Total Votes | |
|---|---|---|---|---|
| Greg Abbott* | Republican party | 75% | 3,221 |
| Gina Hinojosa | Democrat party | 23% | 1,007 |
Marion County
Live results
Updated: Nov. 5, 11:46 AM ET
| Candidate | Party | % | Total Votes | |
|---|---|---|---|---|
| Greg Abbott* | Republican party | 71% | 2,736 |
| Gina Hinojosa | Democrat party | 26% | 1,010 |
Martin County
Live results
Updated: Nov. 5, 11:46 AM ET
| Candidate | Party | % | Total Votes | |
|---|---|---|---|---|
| Greg Abbott* | Republican party | 78% | 1,157 |
| Gina Hinojosa | Democrat party | 20% | 290 |
Mason County
Live results
Updated: Nov. 5, 11:46 AM ET
| Candidate | Party | % | Total Votes | |
|---|---|---|---|---|
| Greg Abbott* | Republican party | 77% | 1,666 |
| Gina Hinojosa | Democrat party | 21% | 451 |
Matagorda County
Live results
Updated: Nov. 5, 11:46 AM ET
| Candidate | Party | % | Total Votes | |
|---|---|---|---|---|
| Greg Abbott* | Republican party | 65% | 7,128 |
| Gina Hinojosa | Democrat party | 33% | 3,587 |
Maverick County
Live results
Updated: Nov. 5, 11:46 AM ET
| Candidate | Party | % | Total Votes | |
|---|---|---|---|---|
| Gina Hinojosa | Democrat party | 67% | 8,651 |
| Greg Abbott* | Republican party | 32% | 4,111 |
Medina County
Live results
Updated: Nov. 5, 11:46 AM ET
| Candidate | Party | % | Total Votes | |
|---|---|---|---|---|
| Greg Abbott* | Republican party | 62% | 13,178 |
| Gina Hinojosa | Democrat party | 37% | 7,772 |
Menard County
Live results
Updated: Nov. 5, 11:46 AM ET
| Candidate | Party | % | Total Votes | |
|---|---|---|---|---|
| Greg Abbott* | Republican party | 76% | 599 |
| Gina Hinojosa | Democrat party | 22% | 175 |
Midland County
Live results
Updated: Nov. 5, 11:46 AM ET
| Candidate | Party | % | Total Votes | |
|---|---|---|---|---|
| Greg Abbott* | Republican party | 70% | 30,904 |
| Gina Hinojosa | Democrat party | 28% | 12,480 |
Milam County
Live results
Updated: Nov. 5, 11:46 AM ET
| Candidate | Party | % | Total Votes | |
|---|---|---|---|---|
| Greg Abbott* | Republican party | 71% | 6,144 |
| Gina Hinojosa | Democrat party | 27% | 2,350 |
Mills County
Live results
Updated: Nov. 5, 11:46 AM ET
| Candidate | Party | % | Total Votes | |
|---|---|---|---|---|
| Greg Abbott* | Republican party | 83% | 1,777 |
| Gina Hinojosa | Democrat party | 15% | 326 |
Mitchell County
Live results
Updated: Nov. 5, 11:46 AM ET
| Candidate | Party | % | Total Votes | |
|---|---|---|---|---|
| Greg Abbott* | Republican party | 80% | 1,500 |
| Gina Hinojosa | Democrat party | 18% | 330 |
Montague County
Live results
Updated: Nov. 5, 11:46 AM ET
| Candidate | Party | % | Total Votes | |
|---|---|---|---|---|
| Greg Abbott* | Republican party | 84% | 7,292 |
| Gina Hinojosa | Democrat party | 14% | 1,259 |
Montgomery County
Live results
Updated: Nov. 5, 3:06 PM ET
| Candidate | Party | % | Total Votes | |
|---|---|---|---|---|
| Greg Abbott* | Republican party | 63% | 162,154 |
| Gina Hinojosa | Democrat party | 36% | 93,047 |
Moore County
Live results
Updated: Nov. 5, 11:47 AM ET
| Candidate | Party | % | Total Votes | |
|---|---|---|---|---|
| Greg Abbott* | Republican party | 66% | 2,735 |
| Gina Hinojosa | Democrat party | 32% | 1,329 |
Morris County
Live results
Updated: Nov. 5, 11:47 AM ET
| Candidate | Party | % | Total Votes | |
|---|---|---|---|---|
| Greg Abbott* | Republican party | 69% | 2,932 |
| Gina Hinojosa | Democrat party | 29% | 1,230 |
Motley County
Live results
Updated: Nov. 5, 11:47 AM ET
| Candidate | Party | % | Total Votes | |
|---|---|---|---|---|
| Greg Abbott* | Republican party | 91% | 465 |
| Gina Hinojosa | Democrat party | 7% | 38 |
Nacogdoches County
Live results
Updated: Nov. 5, 11:47 AM ET
| Candidate | Party | % | Total Votes | |
|---|---|---|---|---|
| Greg Abbott* | Republican party | 58% | 12,444 |
| Gina Hinojosa | Democrat party | 41% | 8,785 |
Navarro County
Live results
Updated: Nov. 5, 11:47 AM ET
| Candidate | Party | % | Total Votes | |
|---|---|---|---|---|
| Greg Abbott* | Republican party | 65% | 10,576 |
| Gina Hinojosa | Democrat party | 33% | 5,364 |
Newton County
Live results
Updated: Nov. 5, 11:47 AM ET
| Candidate | Party | % | Total Votes | |
|---|---|---|---|---|
| Greg Abbott* | Republican party | 79% | 3,379 |
| Gina Hinojosa | Democrat party | 20% | 862 |
Nolan County
Live results
Updated: Nov. 5, 11:49 AM ET
| Candidate | Party | % | Total Votes | |
|---|---|---|---|---|
| Greg Abbott* | Republican party | 71% | 2,665 |
| Gina Hinojosa | Democrat party | 27% | 999 |
Nueces County
Live results
Updated: Nov. 5, 11:47 AM ET
| Candidate | Party | % | Total Votes | |
|---|---|---|---|---|
| Gina Hinojosa | Democrat party | 53% | 52,692 |
| Greg Abbott* | Republican party | 46% | 45,887 |
Ochiltree County
Live results
Updated: Nov. 5, 11:47 AM ET
| Candidate | Party | % | Total Votes | |
|---|---|---|---|---|
| Greg Abbott* | Republican party | 77% | 1,790 |
| Gina Hinojosa | Democrat party | 22% | 515 |
Oldham County
Live results
Updated: Nov. 5, 11:47 AM ET
| Candidate | Party | % | Total Votes | |
|---|---|---|---|---|
| Greg Abbott* | Republican party | 86% | 640 |
| Gina Hinojosa | Democrat party | 12% | 90 |
Orange County
Live results
Updated: Nov. 5, 11:47 AM ET
| Candidate | Party | % | Total Votes | |
|---|---|---|---|---|
| Greg Abbott* | Republican party | 76% | 20,096 |
| Gina Hinojosa | Democrat party | 23% | 6,012 |
Palo Pinto County
Live results
Updated: Nov. 5, 11:47 AM ET
| Candidate | Party | % | Total Votes | |
|---|---|---|---|---|
| Greg Abbott* | Republican party | 74% | 7,663 |
| Gina Hinojosa | Democrat party | 24% | 2,524 |
Panola County
Live results
Updated: Nov. 5, 11:47 AM ET
| Candidate | Party | % | Total Votes | |
|---|---|---|---|---|
| Greg Abbott* | Republican party | 77% | 6,607 |
| Gina Hinojosa | Democrat party | 22% | 1,859 |
Parker County
Live results
Updated: Nov. 5, 11:47 AM ET
| Candidate | Party | % | Total Votes | |
|---|---|---|---|---|
| Greg Abbott* | Republican party | 76% | 58,039 |
| Gina Hinojosa | Democrat party | 22% | 16,879 |
Parmer County
Live results
Updated: Nov. 5, 11:47 AM ET
| Candidate | Party | % | Total Votes | |
|---|---|---|---|---|
| Greg Abbott* | Republican party | 72% | 1,433 |
| Gina Hinojosa | Democrat party | 26% | 509 |
Pecos County
Live results
Updated: Nov. 5, 11:47 AM ET
| Candidate | Party | % | Total Votes | |
|---|---|---|---|---|
| Greg Abbott* | Republican party | 57% | 1,934 |
| Gina Hinojosa | Democrat party | 41% | 1,384 |
Polk County
Live results
Updated: Nov. 5, 11:47 AM ET
| Candidate | Party | % | Total Votes | |
|---|---|---|---|---|
| Greg Abbott* | Republican party | 74% | 12,952 |
| Gina Hinojosa | Democrat party | 25% | 4,345 |
Potter County
Live results
Updated: Nov. 5, 11:47 AM ET
| Candidate | Party | % | Total Votes | |
|---|---|---|---|---|
| Greg Abbott* | Republican party | 61% | 15,743 |
| Gina Hinojosa | Democrat party | 37% | 9,605 |
Presidio County
Live results
Updated: Nov. 5, 11:47 AM ET
| Candidate | Party | % | Total Votes | |
|---|---|---|---|---|
| Gina Hinojosa | Democrat party | 77% | 1,477 |
| Greg Abbott* | Republican party | 23% | 437 |
Rains County
Live results
Updated: Nov. 5, 11:47 AM ET
| Candidate | Party | % | Total Votes | |
|---|---|---|---|---|
| Greg Abbott* | Republican party | 81% | 4,143 |
| Gina Hinojosa | Democrat party | 17% | 860 |
Randall County
Live results
Updated: Nov. 5, 11:47 AM ET
| Candidate | Party | % | Total Votes | |
|---|---|---|---|---|
| Greg Abbott* | Republican party | 72% | 38,301 |
| Gina Hinojosa | Democrat party | 27% | 14,179 |
Reagan County
Live results
Updated: Nov. 5, 11:47 AM ET
| Candidate | Party | % | Total Votes | |
|---|---|---|---|---|
| Greg Abbott* | Republican party | 69% | 482 |
| Gina Hinojosa | Democrat party | 28% | 199 |
Real County
Live results
Updated: Nov. 5, 11:47 AM ET
| Candidate | Party | % | Total Votes | |
|---|---|---|---|---|
| Greg Abbott* | Republican party | 80% | 1,193 |
| Gina Hinojosa | Democrat party | 19% | 279 |
Red River County
Live results
Updated: Nov. 5, 11:47 AM ET
| Candidate | Party | % | Total Votes | |
|---|---|---|---|---|
| Greg Abbott* | Republican party | 73% | 3,106 |
| Gina Hinojosa | Democrat party | 25% | 1,051 |
Reeves County
Live results
Updated: Nov. 5, 11:47 AM ET
| Candidate | Party | % | Total Votes | |
|---|---|---|---|---|
| Greg Abbott* | Republican party | 51% | 1,604 |
| Gina Hinojosa | Democrat party | 47% | 1,483 |
Refugio County
Live results
Updated: Nov. 5, 11:47 AM ET
| Candidate | Party | % | Total Votes | |
|---|---|---|---|---|
| Greg Abbott* | Republican party | 63% | 1,532 |
| Gina Hinojosa | Democrat party | 35% | 856 |
Roberts County
Live results
Updated: Nov. 5, 11:47 AM ET
| Candidate | Party | % | Total Votes | |
|---|---|---|---|---|
| Greg Abbott* | Republican party | 94% | 428 |
| Gina Hinojosa | Democrat party | 5% | 22 |
Robertson County
Live results
Updated: Nov. 5, 11:47 AM ET
| Candidate | Party | % | Total Votes | |
|---|---|---|---|---|
| Greg Abbott* | Republican party | 68% | 4,766 |
| Gina Hinojosa | Democrat party | 30% | 2,117 |
Rockwall County
Live results
Updated: Nov. 5, 11:47 AM ET
| Candidate | Party | % | Total Votes | |
|---|---|---|---|---|
| Greg Abbott* | Republican party | 62% | 33,515 |
| Gina Hinojosa | Democrat party | 36% | 19,309 |
Runnels County
Live results
Updated: Nov. 5, 11:47 AM ET
| Candidate | Party | % | Total Votes | |
|---|---|---|---|---|
| Greg Abbott* | Republican party | 82% | 2,622 |
| Gina Hinojosa | Democrat party | 16% | 506 |
Rusk County
Live results
Updated: Nov. 5, 11:47 AM ET
| Candidate | Party | % | Total Votes | |
|---|---|---|---|---|
| Greg Abbott* | Republican party | 71% | 12,306 |
| Gina Hinojosa | Democrat party | 28% | 4,795 |
Sabine County
Live results
Updated: Nov. 5, 11:47 AM ET
| Candidate | Party | % | Total Votes | |
|---|---|---|---|---|
| Greg Abbott* | Republican party | 85% | 3,653 |
| Gina Hinojosa | Democrat party | 13% | 576 |
San Augustine County
Live results
Updated: Nov. 5, 11:48 AM ET
| Candidate | Party | % | Total Votes | |
|---|---|---|---|---|
| Greg Abbott* | Republican party | 71% | 2,208 |
| Gina Hinojosa | Democrat party | 27% | 845 |
San Jacinto County
Live results
Updated: Nov. 5, 11:48 AM ET
| Candidate | Party | % | Total Votes | |
|---|---|---|---|---|
| Greg Abbott* | Republican party | 76% | 7,887 |
| Gina Hinojosa | Democrat party | 23% | 2,354 |
San Patricio County
Live results
Updated: Nov. 5, 3:06 PM ET
| Candidate | Party | % | Total Votes | |
|---|---|---|---|---|
| Greg Abbott* | Republican party | 58% | 11,634 |
| Gina Hinojosa | Democrat party | 41% | 8,178 |
San Saba County
Live results
Updated: Nov. 5, 11:48 AM ET
| Candidate | Party | % | Total Votes | |
|---|---|---|---|---|
| Greg Abbott* | Republican party | 83% | 1,810 |
| Gina Hinojosa | Democrat party | 16% | 356 |
Schleicher County
Live results
Updated: Nov. 5, 11:48 AM ET
| Candidate | Party | % | Total Votes | |
|---|---|---|---|---|
| Greg Abbott* | Republican party | 73% | 673 |
| Gina Hinojosa | Democrat party | 26% | 236 |
Scurry County
Live results
Updated: Nov. 5, 11:48 AM ET
| Candidate | Party | % | Total Votes | |
|---|---|---|---|---|
| Greg Abbott* | Republican party | 79% | 3,329 |
| Gina Hinojosa | Democrat party | 19% | 789 |
Shackelford County
Live results
Updated: Nov. 5, 11:48 AM ET
| Candidate | Party | % | Total Votes | |
|---|---|---|---|---|
| Greg Abbott* | Republican party | 86% | 1,109 |
| Gina Hinojosa | Democrat party | 12% | 149 |
Shelby County
Live results
Updated: Nov. 5, 11:48 AM ET
| Candidate | Party | % | Total Votes | |
|---|---|---|---|---|
| Greg Abbott* | Republican party | 75% | 5,603 |
| Gina Hinojosa | Democrat party | 24% | 1,830 |
Sherman County
Live results
Updated: Nov. 5, 11:48 AM ET
| Candidate | Party | % | Total Votes | |
|---|---|---|---|---|
| Greg Abbott* | Republican party | 80% | 568 |
| Gina Hinojosa | Democrat party | 17% | 122 |
Smith County
Live results
Updated: Nov. 5, 11:48 AM ET
| Candidate | Party | % | Total Votes | |
|---|---|---|---|---|
| Greg Abbott* | Republican party | 64% | 56,878 |
| Gina Hinojosa | Democrat party | 35% | 31,022 |
Somervell County
Live results
Updated: Nov. 5, 11:48 AM ET
| Candidate | Party | % | Total Votes | |
|---|---|---|---|---|
| Greg Abbott* | Republican party | 79% | 3,426 |
| Gina Hinojosa | Democrat party | 19% | 822 |
Starr County
Live results
Updated: Nov. 5, 11:48 AM ET
| Candidate | Party | % | Total Votes | |
|---|---|---|---|---|
| Gina Hinojosa | Democrat party | 74% | 10,091 |
| Greg Abbott* | Republican party | 25% | 3,435 |
Stephens County
Live results
Updated: Nov. 5, 11:48 AM ET
| Candidate | Party | % | Total Votes | |
|---|---|---|---|---|
| Greg Abbott* | Republican party | 82% | 2,297 |
| Gina Hinojosa | Democrat party | 16% | 452 |
Sterling County
Live results
Updated: Nov. 5, 11:48 AM ET
| Candidate | Party | % | Total Votes | |
|---|---|---|---|---|
| Greg Abbott* | Republican party | 81% | 365 |
| Gina Hinojosa | Democrat party | 14% | 64 |
Stonewall County
Live results
Updated: Nov. 5, 11:48 AM ET
| Candidate | Party | % | Total Votes | |
|---|---|---|---|---|
| Greg Abbott* | Republican party | 79% | 407 |
| Gina Hinojosa | Democrat party | 20% | 103 |
Sutton County
Live results
Updated: Nov. 5, 11:48 AM ET
| Candidate | Party | % | Total Votes | |
|---|---|---|---|---|
| Greg Abbott* | Republican party | 75% | 824 |
| Gina Hinojosa | Democrat party | 24% | 262 |
Swisher County
Live results
Updated: Nov. 5, 11:48 AM ET
| Candidate | Party | % | Total Votes | |
|---|---|---|---|---|
| Greg Abbott* | Republican party | 73% | 1,256 |
| Gina Hinojosa | Democrat party | 24% | 420 |
Tarrant County
Live results
Updated: Nov. 5, 11:48 AM ET
| Candidate | Party | % | Total Votes | |
|---|---|---|---|---|
| Gina Hinojosa | Democrat party | 56% | 410,931 |
| Greg Abbott* | Republican party | 42% | 307,297 |
Taylor County
Live results
Updated: Nov. 5, 11:48 AM ET
| Candidate | Party | % | Total Votes | |
|---|---|---|---|---|
| Greg Abbott* | Republican party | 66% | 28,362 |
| Gina Hinojosa | Democrat party | 32% | 13,494 |
Terrell County
Live results
Updated: Nov. 5, 11:48 AM ET
| Candidate | Party | % | Total Votes | |
|---|---|---|---|---|
| Greg Abbott* | Republican party | 73% | 252 |
| Gina Hinojosa | Democrat party | 26% | 90 |
Terry County
Live results
Updated: Nov. 5, 11:48 AM ET
| Candidate | Party | % | Total Votes | |
|---|---|---|---|---|
| Greg Abbott* | Republican party | 72% | 1,896 |
| Gina Hinojosa | Democrat party | 26% | 680 |
Throckmorton County
Live results
Updated: Nov. 5, 11:48 AM ET
| Candidate | Party | % | Total Votes | |
|---|---|---|---|---|
| Greg Abbott* | Republican party | 84% | 526 |
| Gina Hinojosa | Democrat party | 13% | 84 |
Titus County
Live results
Updated: Nov. 5, 11:48 AM ET
| Candidate | Party | % | Total Votes | |
|---|---|---|---|---|
| Greg Abbott* | Republican party | 63% | 5,534 |
| Gina Hinojosa | Democrat party | 35% | 3,082 |
Tom Green County
Live results
Updated: Nov. 5, 11:48 AM ET
| Candidate | Party | % | Total Votes | |
|---|---|---|---|---|
| Greg Abbott* | Republican party | 64% | 23,333 |
| Gina Hinojosa | Democrat party | 34% | 12,204 |
Travis County
Live results
Updated: Nov. 5, 11:48 AM ET
| Candidate | Party | % | Total Votes | |
|---|---|---|---|---|
| Gina Hinojosa | Democrat party | 76% | 415,011 |
| Greg Abbott* | Republican party | 23% | 127,275 |
Trinity County
Live results
Updated: Nov. 5, 11:48 AM ET
| Candidate | Party | % | Total Votes | |
|---|---|---|---|---|
| Greg Abbott* | Republican party | 78% | 4,480 |
| Gina Hinojosa | Democrat party | 21% | 1,210 |
Tyler County
Live results
Updated: Nov. 5, 11:48 AM ET
| Candidate | Party | % | Total Votes | |
|---|---|---|---|---|
| Greg Abbott* | Republican party | 82% | 5,967 |
| Gina Hinojosa | Democrat party | 16% | 1,171 |
Upshur County
Live results
Updated: Nov. 5, 11:48 AM ET
| Candidate | Party | % | Total Votes | |
|---|---|---|---|---|
| Greg Abbott* | Republican party | 79% | 12,228 |
| Gina Hinojosa | Democrat party | 20% | 3,054 |
Upton County
Live results
Updated: Nov. 5, 11:48 AM ET
| Candidate | Party | % | Total Votes | |
|---|---|---|---|---|
| Greg Abbott* | Republican party | 77% | 672 |
| Gina Hinojosa | Democrat party | 21% | 182 |
Uvalde County
Live results
Updated: Nov. 5, 11:48 AM ET
| Candidate | Party | % | Total Votes | |
|---|---|---|---|---|
| Greg Abbott* | Republican party | 53% | 4,420 |
| Gina Hinojosa | Democrat party | 46% | 3,832 |
Val Verde County
Live results
Updated: Nov. 5, 11:48 AM ET
| Candidate | Party | % | Total Votes | |
|---|---|---|---|---|
| Gina Hinojosa | Democrat party | 51% | 6,025 |
| Greg Abbott* | Republican party | 47% | 5,565 |
Van Zandt County
Live results
Updated: Nov. 5, 11:48 AM ET
| Candidate | Party | % | Total Votes | |
|---|---|---|---|---|
| Greg Abbott* | Republican party | 81% | 17,973 |
| Gina Hinojosa | Democrat party | 17% | 3,888 |
Victoria County
Live results
Updated: Nov. 5, 12:18 PM ET
| Candidate | Party | % | Total Votes | |
|---|---|---|---|---|
| Greg Abbott* | Republican party | 63% | 17,869 |
| Gina Hinojosa | Democrat party | 36% | 10,148 |
Walker County
Live results
Updated: Nov. 5, 11:49 AM ET
| Candidate | Party | % | Total Votes | |
|---|---|---|---|---|
| Greg Abbott* | Republican party | 61% | 13,160 |
| Gina Hinojosa | Democrat party | 38% | 8,217 |
Waller County
Live results
Updated: Nov. 5, 11:49 AM ET
| Candidate | Party | % | Total Votes | |
|---|---|---|---|---|
| Greg Abbott* | Republican party | 52% | 12,348 |
| Gina Hinojosa | Democrat party | 47% | 11,045 |
Ward County
Live results
Updated: Nov. 5, 11:49 AM ET
| Candidate | Party | % | Total Votes | |
|---|---|---|---|---|
| Greg Abbott* | Republican party | 72% | 1,842 |
| Gina Hinojosa | Democrat party | 26% | 680 |
Washington County
Live results
Updated: Nov. 5, 11:49 AM ET
| Candidate | Party | % | Total Votes | |
|---|---|---|---|---|
| Greg Abbott* | Republican party | 72% | 11,143 |
| Gina Hinojosa | Democrat party | 27% | 4,158 |
Webb County
Live results
Updated: Nov. 5, 11:49 AM ET
| Candidate | Party | % | Total Votes | |
|---|---|---|---|---|
| Gina Hinojosa | Democrat party | 69% | 40,593 |
| Greg Abbott* | Republican party | 29% | 17,299 |
Wharton County
Live results
Updated: Nov. 5, 11:49 AM ET
| Candidate | Party | % | Total Votes | |
|---|---|---|---|---|
| Greg Abbott* | Republican party | 68% | 8,607 |
| Gina Hinojosa | Democrat party | 31% | 3,907 |
Wheeler County
Live results
Updated: Nov. 5, 11:49 AM ET
| Candidate | Party | % | Total Votes | |
|---|---|---|---|---|
| Greg Abbott* | Republican party | 85% | 1,432 |
| Gina Hinojosa | Democrat party | 13% | 227 |
Wichita County
Live results
Updated: Nov. 5, 11:49 AM ET
| Candidate | Party | % | Total Votes | |
|---|---|---|---|---|
| Greg Abbott* | Republican party | 63% | 21,926 |
| Gina Hinojosa | Democrat party | 35% | 11,989 |
Wilbarger County
Live results
Updated: Nov. 5, 11:49 AM ET
| Candidate | Party | % | Total Votes | |
|---|---|---|---|---|
| Greg Abbott* | Republican party | 73% | 2,470 |
| Gina Hinojosa | Democrat party | 25% | 866 |
Willacy County
Live results
Updated: Nov. 5, 11:49 AM ET
| Candidate | Party | % | Total Votes | |
|---|---|---|---|---|
| Gina Hinojosa | Democrat party | 64% | 2,973 |
| Greg Abbott* | Republican party | 35% | 1,644 |
Williamson County
Live results
Updated: Nov. 5, 3:34 PM ET
| Candidate | Party | % | Total Votes | |
|---|---|---|---|---|
| Gina Hinojosa | Democrat party | 56% | 156,631 |
| Greg Abbott* | Republican party | 42% | 118,285 |
Wilson County
Live results
Updated: Nov. 5, 11:49 AM ET
| Candidate | Party | % | Total Votes | |
|---|---|---|---|---|
| Greg Abbott* | Republican party | 69% | 15,294 |
| Gina Hinojosa | Democrat party | 29% | 6,423 |
Winkler County
Live results
Updated: Nov. 5, 11:49 AM ET
| Candidate | Party | % | Total Votes | |
|---|---|---|---|---|
| Greg Abbott* | Republican party | 72% | 970 |
| Gina Hinojosa | Democrat party | 27% | 365 |
Wise County
Live results
Updated: Nov. 5, 3:06 PM ET
| Candidate | Party | % | Total Votes | |
|---|---|---|---|---|
| Greg Abbott* | Republican party | 77% | 23,801 |
| Gina Hinojosa | Democrat party | 22% | 6,707 |
Wood County
Live results
Updated: Nov. 5, 11:49 AM ET
| Candidate | Party | % | Total Votes | |
|---|---|---|---|---|
| Greg Abbott* | Republican party | 81% | 15,999 |
| Gina Hinojosa | Democrat party | 18% | 3,531 |
Yoakum County
Live results
Updated: Nov. 5, 11:49 AM ET
| Candidate | Party | % | Total Votes | |
|---|---|---|---|---|
| Greg Abbott* | Republican party | 70% | 1,242 |
| Gina Hinojosa | Democrat party | 28% | 500 |
Young County
Live results
Updated: Nov. 5, 11:49 AM ET
| Candidate | Party | % | Total Votes | |
|---|---|---|---|---|
| Greg Abbott* | Republican party | 81% | 5,348 |
| Gina Hinojosa | Democrat party | 17% | 1,129 |
Zapata County
Live results
Updated: Nov. 5, 11:49 AM ET
| Candidate | Party | % | Total Votes | |
|---|---|---|---|---|
| Gina Hinojosa | Democrat party | 65% | 2,194 |
| Greg Abbott* | Republican party | 34% | 1,133 |
Zavala County
Live results
Updated: Nov. 5, 11:49 AM ET
| Candidate | Party | % | Total Votes | |
|---|---|---|---|---|
| Gina Hinojosa | Democrat party | 72% | 2,262 |
| Greg Abbott* | Republican party | 26% | 825 |